CW3E Publication Notice: The Circulation Response of a Two-Dimensional Frontogenetic Model to Optimized Moisture Perturbations

CW3E Publication Notice

The Circulation Response of a Two-Dimensional Frontogenetic Model to Optimized Moisture Perturbations

February 8, 2021

Reuben Demirdjian, a CW3E PhD graduate who is currently a Postdoctoral Scholar at the Naval Research Laboratory, recently published a paper in the Journal of the Atmospheric Sciences, along with co-authors and CW3E affiliates Richard Rotunno of the National Center for Atmospheric Research, Bruce D. Cornuelle of Scripps Institution of Oceanography, and Carolyn A. Reynolds, and James D. Doyle of the Naval Research Laboratory (Demirdjian et al. 2021). This study contributes to the goal stated in CW3E’s 2019-2024 Strategic Plan to support modeling capabilities for the western United States by developing and testing coupled weather, ocean, and hydrologic modeling systems to improve prediction of precipitation and streamflow.

The study uses an idealized two-dimensional moist semigeostrophic model to assess the role of moisture small moisture perturbations on developing atmospheric rivers. The objectives are to (i) investigate the dynamics responsible for moisture-perturbation growth, and (ii) quantify the relation between the moisture-perturbation amplitude and the strength of the circulation response. Results show that adding relatively small amounts of moisture can increase frontogenesis, strengthen the transverse circulation, intensify the low-level potential-vorticity (PV) anomaly, and strengthen the low-level jet (LLJ). The progression of physical processes responsible for the nonlinear effect of moisture perturbations on the forecast is (in order) (1) jet/front transverse circulation; (2) moisture convergence ahead of the front; (3) latent heating at mid- to low elevations; (4) reduction in static stability ahead of the front; (5) strengthening of the transverse circulation (Figure 1). Together, these physical processes represent a pathway by which small perturbations of moisture can have a strong impact on a forecast involving midlatitude frontogenesis. The physical processes outlined in Fig. 1 demonstrates that the frontogenetic circulation can respond to moisture perturbations by increasing along front circulations. This advance in our understanding of the dynamics associated with the growth of moist perturbations has led to a more complete understanding of AR dynamics and forecast challenges. This physical argument of a strong precipitation forecast dependence on the initial-condition moisture content highlights the importance of campaigns like Atmospheric River Reconnaissance in regions like the Northeast Pacific that otherwise would have significant gaps without vertically resolved moisture data.

Figure 1: Figure 13 in Demirdjian et al., 2021: A schematic representation of the important physical processes discussed in this study. The potential temperature (gray contours), latent heating (LH; thick red oval), along-front geostrophic wind (color shades with increasing value from orange to red), and the ageostrophic streamfunction (transverse circulation; large black circle). The direction of the transverse circulation is denoted by the black arrows, with successively smaller arrows indicating regions of convergence. The dashed gray lines denote changes to the potential temperature resulting from latent-heating effects. The order of processes is labeled numerically, with dotted black arrows connecting them for continuity. The Brunt–Väisälä frequency before and after the latent heating is measured by N2 and N2s, respectively.

Demirdjian, R., R. Rotunno, B. D. Cornuelle, C. A. Reynolds, and J. D. Doyle, 2021: The Circulation Response of a Two-Dimensional Frontogenetic Model to Optimized Moisture Perturbations. J. Atmos. Sci., 78, 459-472, https://doi.org/10.1175/JAS-D-20-0102.1.

CW3E Event Summary: 26-29 January 2021

CW3E Event Summary: 26-29 January 2021

February 2, 2021

Click here for a pdf of this information.

An Atmospheric River and a Strong Surface Cyclone Produced Significant Impacts Across much of California

  • The AR made landfall at ~00 UTC 27 January in association with a powerful surface cyclone over the Northeast Pacific Ocean
  • Over the next few days, the AR gradually propagated southward along the coast of California, but not before pivoting and stalling over Central California
  • Some areas in Central California experienced AR conditions for nearly 48 consecutive hours, resulting in an AR 2 (based on the Ralph et al. 2019 AR Scale)
  • A strong low-level jet in the warm sector of the surface cyclone led to the development of a narrow cold-frontal rainband (NCFR)
  • Intense rainfall on recent burn scars caused damaging debris flows in Central and Southern California
  • More than 7 inches of precipitation fell in portions of the Sierra Nevada, Central California Coast Ranges, and western Transverse Ranges, with the highest observed amounts in western Monterey and San Luis Obispo Counties
  • Several feet of snow accumulated across the Sierra Nevada, resulting in closures of major highways

Click images to see loops of GFS IVT/IWV analyses

Valid 0000 UTC 26 January – 0000 UTC 30 January


Summary provided by C. Castellano, J. Cordeira, J. Kalansky, N. Oakley, and F. M. Ralph; 2 February 2021

CW3E AR Update: 25 January 2021 Outlook

CW3E AR Update: 25 January 2021 Outlook

January 25, 2021

Click here for a pdf of this information.

Strong atmospheric river may bring several hydrologic impacts to large portion of California early this week

  • A strong atmospheric river (AR) is forecast to make landfall around 4 PM PST tomorrow, 26 January 2021
  • The AR is then forecast to propagate down the coast, bringing AR 1 to potentially 3 conditions to a large stretch of the Central CA Coast.
  • Several locations across the Central Coast and the high elevations of the Sierra could receive more than 10 inches of precipitation.
  • Low freezing levels (<4000 feet) associated with this system could result in 2+ feet of snow over the Coastal and Sierra Nevada Mountains
  • While storm total precipitation could result in numerous impacts, mesoscale models are currently highlighting the potential development of a narrow cold frontal rainband, which could produce high-intensity, short duration, precipitation, a driver of post-fire debris flows.

Click images to see loops of GFS IVT & IWV forecasts

Valid 1200 UTC 25 January – 0000 UTC 2 February 2021


Summary provided by C. Hecht, B. Kawzenuk, N. Oakley, J. Kalansky, and F. M. Ralph; 25 January 2021

*Outlook products are considered experimental

CW3E Welcomes Jiabao Wang

CW3E Welcomes Jiabao Wang

January 25, 2021

Dr. Jiabao Wang joined CW3E as a postdoctoral research scholar in January 2021. She received her B.S. (2013) and M.S. (2015) degrees in Meteorology from Sun Yat-sen University in China. She earned her Ph.D. degree in December 2020 from the School of Marine and Atmospheric Sciences at Stony Brook University under the advisement of Dr. Hyemi Kim.

Jiabao’s prior research work includes investigations of midlatitude storm tracks and their interactions with Arctic amplification and the Quasi-biennial oscillation, as well as intraseasonal oscillations (e.g., the Madden-Julian oscillation, MJO) and their teleconnections to the midlatitudes. She has published five first-author journal articles during her time as a Ph.D. student. She also led the development of a set of standardized MJO teleconnection diagnostics as a joint effort between the Working Group on Numerical Experimentation (WGNE) MJO Task Force and the WMO Subseasonal-to-Seasonal (S2S) teleconnection subproject, which enables a consistent investigation of MJO teleconnection variations and impacts, and objective assessment and comparison of teleconnection performance among different models and across model generations. Jiabao’s Ph.D. research detailed the observational MJO teleconnection characteristics and evaluated its reproduction by CMIP models. She also used a linear baroclinic model to explore the dynamical processes controlling the teleconnection variations, simulation fidelity, and future changes in a warming climate.

At CW3E, Jiabao will be working with the S2S group under the supervision of Dr. Mike DeFlorio. Her research will focus on improving the understanding of S2S variability of extreme precipitation and atmospheric rivers (ARs) over the Western US., such as their intrinsic characteristics, simulation capability by global climate models (CMIP6), and S2S predictability in the hindcast experiments of multimodel ensemble projects (S2S, SubX, or CESM S2S hindcasts). Particularly, she will apply her MJO teleconnection metrics for a quantitative examination of the MJO impacts on extreme precipitation and ARs and help evaluate and improve their prediction in ensemble prediction systems at S2S lead times.

CW3E AR Update: 22 January 2021 Outlook

CW3E AR Update: 22 January 2021 Outlook

January 22, 2021

Click here for a pdf of this information.

Active Weather Pattern Forecast Across the Western U.S. this Weekend through Next Week

  • A series of upper-level shortwave disturbances will bring multiple episodes of precipitation to the southwestern U.S. this weekend into early next week
  • At least 1–3 inches of precipitation are forecasted in the Southern Sierra, coastal Southern California, and Central Arizona in association with these shortwave disturbances
  • Significant snowfall accumulations are possible over the higher terrain in the southwestern U.S.
  • There is increasing forecast confidence in a landfalling AR and major precipitation event next week over California
  • However, there is still considerable uncertainty in the location, duration, and intensity of this landfalling AR
  • More than 5 inches of total precipitation are possible over the California Coast Ranges, Sierra Nevada, and Southern California Transverse Ranges during the next 7 days

Click images to see loops of ECMWF IVT & IWV forecasts

Valid 0000 UTC 22 January – 0000 UTC 30 January 2021


Probability of AR Conditions Along Coast: dProg/dt

Model Runs: 00Z 17 Jan – 00Z 22 Jan 2021 (every 12 h)


Summary provided by C. Castellano, C. Hecht, J. Kalansky, and F. M. Ralph; 22 January 2021

*Outlook products are considered experimental

CW3E Event Summary: 11-13 January 2021

CW3E Event Summary: 11-13 January 2021

January 14, 2021

Click here for a pdf of this information.

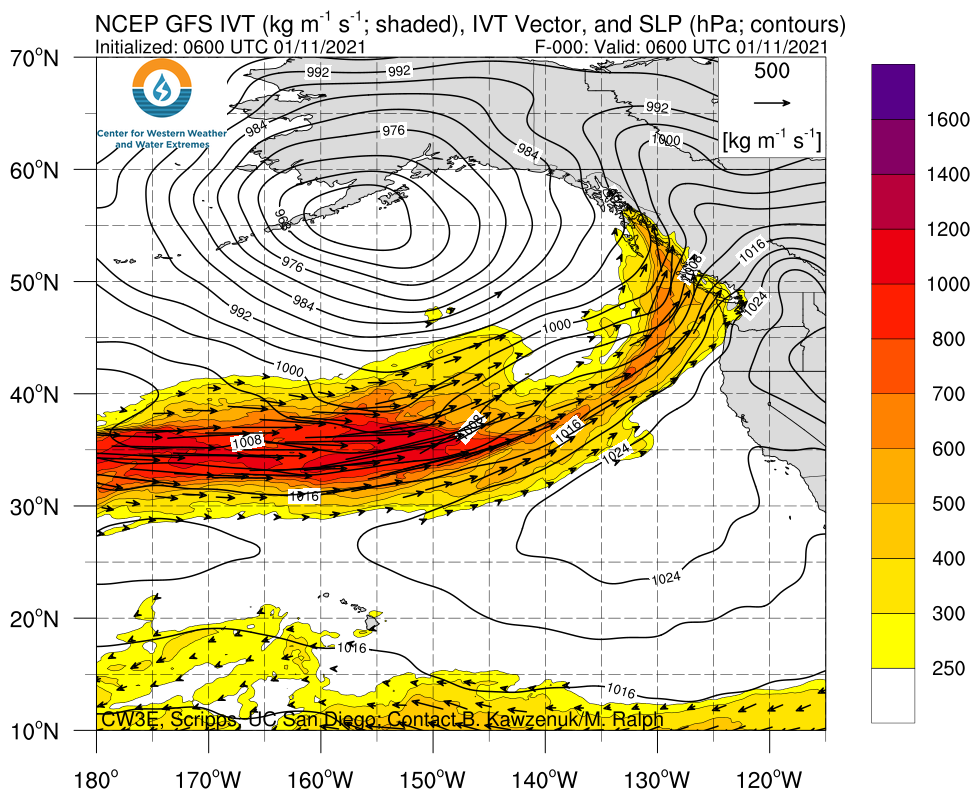
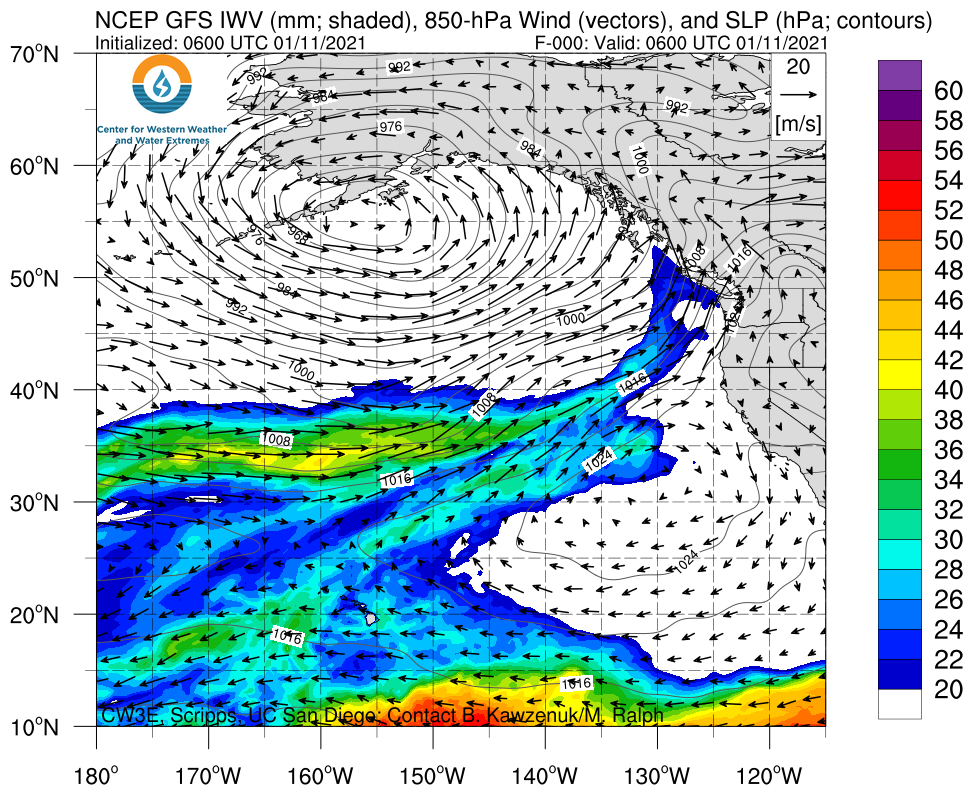
An Extreme Atmospheric River brought AR 5 Conditions and Widespread Hydrologic Impacts to the Pacific Northwest

  • The AR initially made landfall at ~00 UTC 12 January and brought an initial pulse of IVT magnitudes >750 kg m–1 s–1
  • A mesoscale frontal wave developed along the northern periphery of the initial AR, strengthened and moved onshore at ~00 UTC 13 January
  • The secondary pulse of AR conditions was much stronger than the first (>1000 kg m–1 s–1) and helped to prolong the overall duration of the event, resulting in AR 5 conditions
  • More than 5 inches of precipitation fell in portions of the Pacific Coast Ranges and Cascades, with the highest amounts (locally > 10 inches) in the Olympic Peninsula and extreme northwestern Oregon
  • Heavy rainfall on saturated/nearly saturated soils produced widespread flooding and landslides
  • High winds also caused significant tree damage and power outages in western WA and northwestern OR

MIMIC-TPW2 Total Precipitable Water

Valid 0000 UTC 10 January – 0800 UTC 14 January

Images from CIMSS/University of Wisconsin

Click images to see loops of GFS IVT/IWV analyses

Valid 0000 UTC 10 January – 1200 UTC 14 January


Summary provided by C. Castellano, C. Hecht, J. Kalansky, B. Kawzenuk, and F. M. Ralph; 14 January 2021

CW3E AR Update: 12 January 2021 Outlook

CW3E AR Update: 12 January 2021 Outlook

January 12, 2021

Click here for a pdf of this information.

Strong atmospheric river will continue to impact the U.S. West Coast today

  • A strong atmospheric river (AR) made landfall across Washington, Oregon, and Northern California late yesterday
  • Forecasts of maximum IVT magnitude have increased substantially since yesterdays outlook and the GEFS control is now forecasting AR 5 conditions (based on the Ralph et al. 2019 AR Scale) over portions of coastal Oregon
  • Some areas in western Washington and northwestern Oregon have already received 3–5 inches of precipitation
  • An additional 3–7 inches of precipitation are forecast in the Pacific Coast Ranges and Cascades, with the heaviest amounts expected in extreme southwestern Oregon and northwestern California
  • Widespread riverine flooding and landslides are possible in western Washington and Oregon

Click images to see loops of GFS IVT & IWV forecasts

Valid 1200 UTC 12 January – 1200 UTC 16 January 2021


Summary provided by C. Castellano, C. Hecht, J. Kalansky, N. Oakley, and F. M. Ralph; 12 January 2021

*Outlook products are considered experimental

CW3E AR Update: 11 January 2021 Outlook

CW3E AR Update: 11 January 2021 Outlook

January 11, 2021

Click here for a pdf of this information.

Strong atmospheric river to impact the Pacific Northwest this week

  • A strong and zonally elongated atmospheric river (AR) is forecast to make landfall across Washington, Oregon, and Northern California today
  • AR 4 conditions (based on the Ralph et al. 2019 AR Scale) are possible over coastal Oregon and Washington
  • At least 3–7 inches of precipitation are expected in the Pacific Coast Ranges and Cascades
  • More than 2 feet of snow is forecast in the higher terrain of the Olympic Mountains and Washington Cascades
  • Intense precipitation falling in areas with saturated soils and existing burn scars from the 2020 wildfires may result in flooding and debris flows in western Washington and Oregon

Click images to see loops of GFS IVT & IWV forecasts

Valid 0600 UTC 11 January – 0600 UTC 15 January 2021


Summary provided by C. Castellano, C. Hecht, J. Kalansky, N. Oakley, and F. M. Ralph; 11 January 2021

*Outlook products are considered experimental

CW3E Event Summary: 1-7 January 2021

CW3E Event Summary: 1-7 January 2021

January 8, 2021

Click here for a pdf of this information.

Active weather pattern produces an extremely wet start to 2021 in the Pacific Northwest

  • Several ARs associated with a series of storms over the Northeast Pacific Ocean impacted the Pacific Northwest during the first week of 2021
  • These storms produced at least 2–7 inches of total precipitation in northwestern California, western Oregon, and western Washington, with the highest amounts (> 10 inches) in the Olympic Mountains and North Cascades
  • More than 5 feet of snow fell in parts of the Olympic Mountains and Washington Cascades
  • Total water-year-to-date precipitation remains well-below normal across much of the western U.S.

MIMIC-TPW2 Total Precipitable Water

Valid 0000 UTC 1 January – 0000 UTC 7 January

Images from CIMSS/University of Wisconsin

Click images to see loops of GFS IVT/IWV analyses

Valid 0000 UTC 1 January – 0000 UTC 7 January


Summary provided by C. Castellano, J. Kalansky, N. Oakley, and F. M. Ralph; 8 January 2021

CW3E Event Summary: 17-22 December 2020

CW3E Event Summary: 17-22 December 2020

December 23, 2020

Click here for a pdf of this information.

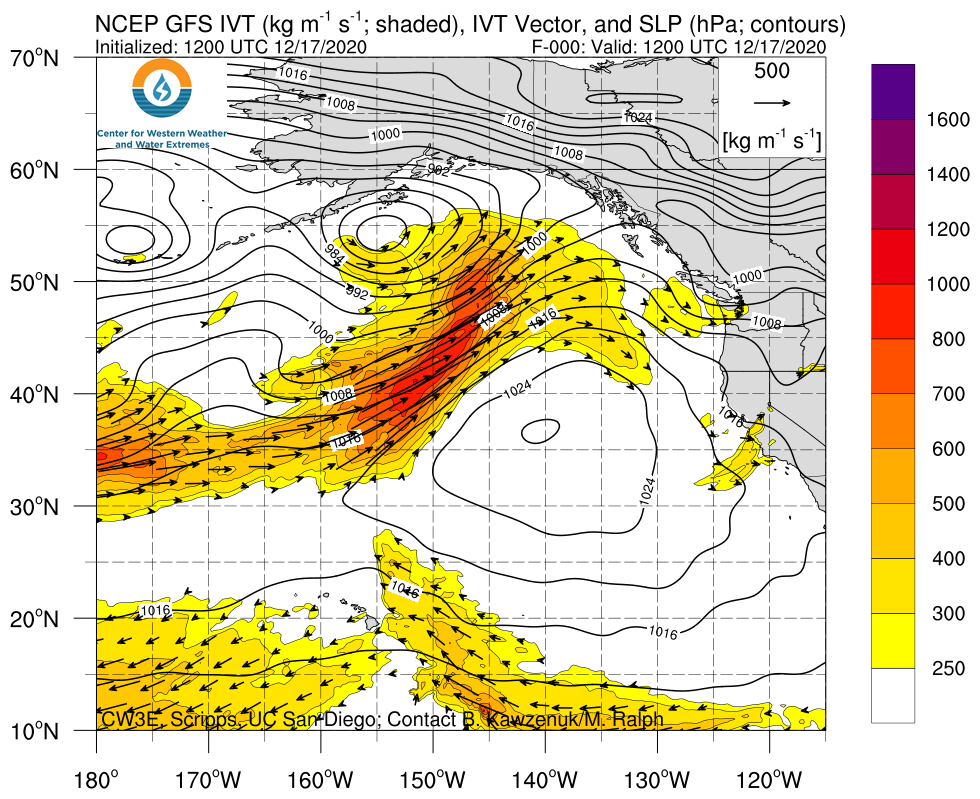
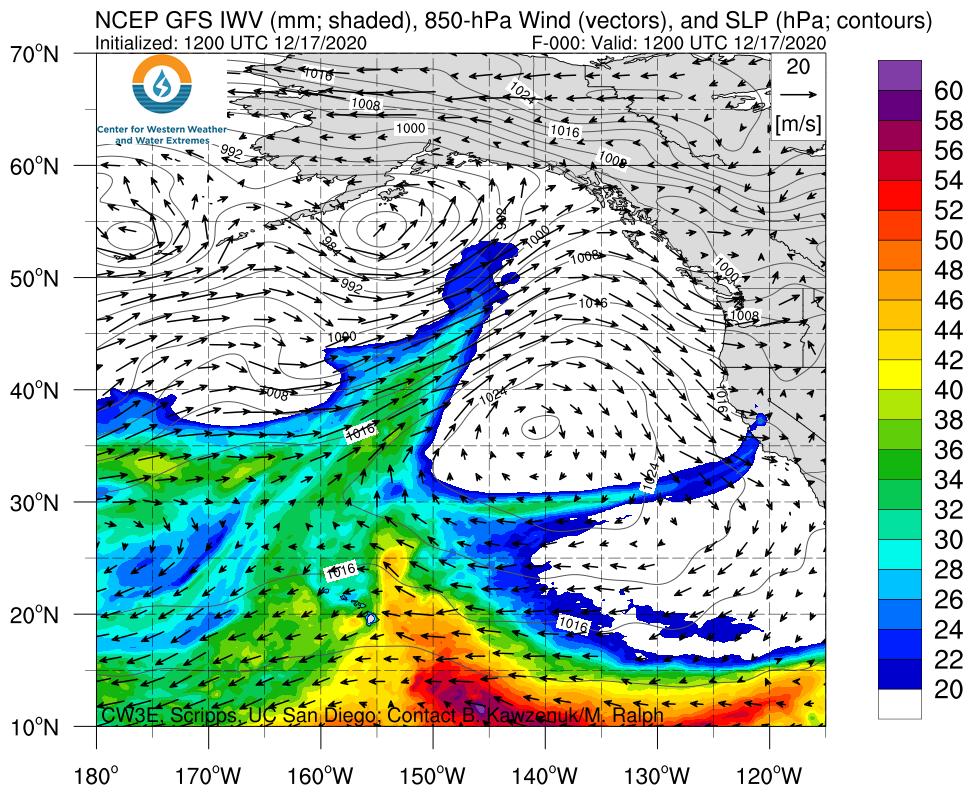
Multiple storms impacted the Pacific Northwest over the Weekend and into Monday

  • The first event brought AR 1 conditions to far northwestern Washington as a decaying AR propagated down the coast from British Columbia
  • The second AR was stronger and lasted several days, bringing AR 3 conditions to Coastal Oregon
  • A mesoscale frontal wave developed along the second AR and resulted in an additional pulse of enhanced IVT and extended the overall duration of AR conditions
  • Several daily precipitation records were broken across the Seattle Metropolitan area where several both urban and river flooding was observed

MIMIC-TPW2 Total Precipitable Water

Valid 1200 UTC 17 December – 1700 UTC 22 December

Images from CIMSS/Univ. of Wisconsin

Click images to see loops of GFS IVT/IWV analyses

Valid 1200 UTC 17 December – 1200 UTC 22 December 2020


Summary provided by C. Hecht, C. Castellano, J. Kalansky, and F. M. Ralph; 23 December 2020