CW3E Publication Notice: Subseasonal‐to‐Seasonal Hindcast Skill Assessment of Ridging Events Related to Drought Over the Western United States

CW3E Publication Notice

Subseasonal‐to‐Seasonal Hindcast Skill Assessment of Ridging Events Related to Drought Over the Western United States

November 23, 2020

CW3E scientist Peter Gibson, along with researchers from CW3E (Michael DeFlorio and Luca Delle Monache), NASA’s Jet Propulsion Laboratory (Duane Waliser and Alexander Goodman) and NASA’s Global Modeling and Assimilation Office (Andrea Molod) recently published an article in the Journal of Geophysical Research: Atmospheres titled “Subseasonal‐to‐Seasonal Hindcast Skill Assessment of Ridging Events Related to Drought Over the Western United States”.

Subseasonal‐to‐Seasonal (S2S) forecasts of atmospheric rivers, precipitation and drought are scientifically challenging, yet are of immense value for stakeholders and decision makers in the water resource management sector. While forecasting precipitation directly on S2S timescales has proven difficult in past research, this study approaches the problem from a different angle – to focus on persistent atmospheric ridging events that are well known to cause drought across the Western United States. In prior research, the authors have developed a ridge detection algorithm that automatically tracks ridging events associated with drought, which can be applied seamlessly across very large observational, weather and climate model datasets.

By applying this ridge detection algorithm, the authors probed the extent to which drought relevant ridging events can be forecasted on S2S timescales (2-6 weeks ahead) in state-of-the-art dynamical forecast models. For certain models, and certain aspects of ridging, the authors found evidence of skillful ridging forecasts across Weeks 3 and 4, and more modest skill across Weeks 5 and 6 lead time. The authors also explored conditions in the climate system that tend to help extend prediction skill in the forecast models as well as conditions that tend to reduce skill. This information is valuable for future research and product development, for bias correcting known errors in the output from forecast models and improving S2S prediction skill.

Figure 1. Probabilistic Brier Skill score (BSS) for predicting above normal occurrence of ridge types (N, S, and W ridge types) across a 2-week period for lead times of weeks 1-2, weeks 3-4 and weeks 5-6. Skill scores above zero indicate model skill compared to a reference prediction. The left panels (a, c) show skill assessed relative to a reference climatology defined by the historical median ridge type frequency across the particular 2-week period. Panels (b,d) show skill assessed relative to randomly sampling (with replacement) from the reference distribution defined by the historical distribution of each ridge type frequency found in reanalysis.

Based on this research, experimental forecasts are being issued in real time by CW3E and are publicly available. This S2S forecast product, as well as the underpinning research, supports CW3E’s Strategic Plan goals for revolutionizing seasonal outlooks of extreme events in North America and their impacts on floods, drought, hydropower, and the economy. This research received funding and support from the California Department of Water Resources.

Gibson, P. B., Waliser, D. E., Goodman, A., DeFlorio, M. J., Delle Monache, L., & Molod, A. (2020). Subseasonal‐to‐seasonal hindcast skill assessment of ridging events related to drought over the Western United States. Journal of Geophysical Research: Atmospheres, 125, https://doi.org/10.1029/2020JD033655.

CW3E Event Summary: 16-18 November 2020

CW3E Event Summary: 16-18 November 2020

November 20, 2020

Click here for a pdf of this information.

Powerful storm and AR bring rain, snow, and wind to the Western U.S.

  • A landfalling AR associated with a surface cyclone over the Northeast Pacific Ocean impacted the Pacific Northwest and Northern California during 16–18 Nov
  • Coastal Oregon and Washington experienced AR 3/AR 4 conditions (based on the Ralph et al. 2019 AR Scale)
  • About 2–5 inches of precipitation fell over the Pacific Coast Ranges, Cascades, and Northern Sierra Nevada, with locally higher amounts in the Olympic Mountains and North Cascades
  • Snowfall accumulations exceeded 12 inches in portions of the Cascades, Sierra Nevada, and Rocky Mountains
  • Strong winds caused minor coastal flooding and scattered power outages in Washington and Oregon

Click images to see loops of GFS IVT/IWV analyses

Valid 0000 UTC 16 November – 1200 UTC 20 November 2020

Summary provided by C. Castellano, C. Hecht, B. Kawzenuk, N. Oakley, and F. M. Ralph; 20 November 2020

CW3E AR Update: 16 November 2020 Outlook

CW3E AR Update: 16 November 2020 Outlook

November 16, 2020

Click here for a pdf of this information.

Active pattern is forecast to continue as another atmospheric river makes landfall this evening

  • Multiple landfalling ARs have produced heavy rainfall and snowfall across the northwestern U.S. and Northern California over the past several days
  • A cyclone and an associated AR currently located over the Eastern Pacific are forecast to strengthen as they propagate towards the Pacific Northwest and southern British Columbia
  • Current forecasts suggest that this AR may bring AR 3–4 conditions (based on the Ralph et al. 2019 AR Scale) to the Pacific Northwest and AR 1–2 conditions to Northern CA
  • The WPC is forecasting as much as 3.5 inches of precipitation across numerous coastal and high elevation locations across the PNW and Northern CA
  • High wind speeds are forecast to impact coastal locations and high elevations from WA to Northern CA

Click images to see loops of GFS IVT/IWV analyses and forecasts

Valid 1200 UTC 16 November – 1200 UTC 26 November 2020


Summary provided by C. Castellano, C. Hecht, J. Kalansky, B. Kawzunek, and F. M. Ralph; 16 November 2020

*Outlook products are considered experimental

CW3E Publication Notice: The Observed Water Vapor Budget in an Atmospheric River over the Northeast Pacific

CW3E Publication Notice

The Observed Water Vapor Budget in an Atmospheric River over the Northeast Pacific

November 16, 2020

Joel Norris, Professor of Climate and Atmospheric Sciences at Scripps Institution of Oceanography and CW3E affiliate, recently published a paper in the Journal of Hydrometeorology along with co-authors including F. Martin Ralph, CW3E Director, Reuben Demirdjian, recently graduated CW3E PhD student, CW3E scientist Forest Cannon, and CW3E affiliate Duane E. Waliser of NASA’s Jet Propulsion Laboratory, among others (Norris et al., 2020). This study contributes to the goals of CW3E’s 2019-2024 Strategic Plan to support Atmospheric River (AR) Research and Applications by furthering our understanding of AR dynamics.

Observing and understanding the processes controlling the water budget of an AR offshore will help us better understand what factors lead to an increase in AR’s Integrated Water Vapor (IWV) content and how much water vapor will be available for precipitation when the AR makes landfall. This is particularly important for water supply and flood risk management, as substantial precipitation and flooding can occur when ARs make landfall in many regions across the world. Observational campaigns, such as those described in this study, are crucial to understanding the processes that modulate IWV. Specifically, lack of budget closure in reanalyses indicates that it is necessary to observationally quantify the magnitudes of precipitation and the dynamical convergence of water vapor and their offsetting contributions to IWV tendency in the AR core.

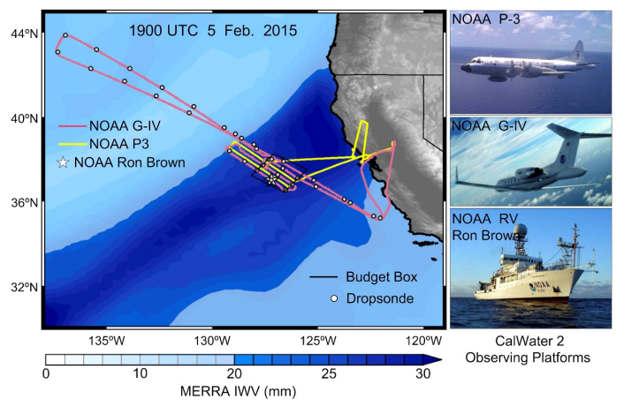
This study uses CalWater2 observations of an AR event on 5 February 2015 collected from the NOAA G-IV and the NOAA R/V Ron Brown (Fig 1) to derive a spatial estimate of precipitation over a ~24,000 km2 oceanic domain off the coast of California. Calculating water vapor budget terms for subregions within the larger budget region allows additional physical insight into the processes controlling the AR’s IWV content. In this specific case, the IWV tendency over the entire domain was dominated by dynamical convergence, and evaporation was negligible. However, the results reveal the substantial spatial variability present in IWV convergence and precipitation at scales of ~50km (Fig 2).

The Norris et al. (2020) study was innovative in many ways. First, precipitation was observationally estimated by conversion of NOAA G-IV tail doppler radar reflectivity to rain rate using a Z-R relationship derived from shipboard disdrometer measurements on the same day. Second, this study documented precipitation, dynamical convergence, and advection for subregions of the main budget domain corresponding to different combinations of dropsonde subsets. And third, this study demonstrated that the water vapor budget of the main region could be observationally closed. The results have implications for our understanding of processes in the frontal sector of ARs, currently a primary source of uncertainty in IWV tendency.

Figure 1. Left: Flight tracks of NOAA G-IV (pink) and NOAA P-3 (yellow), locations of NOAA RHB (star) and dropsondes (circles), and boundary of water vapor budget region (black polygon), all overlaying MERRA-2 IWV for 1900 UTC 5 February 2015 (mm, color scale at bottom). Right: photos of the observing systems. (Figure 1 from Norris et al., 2020)

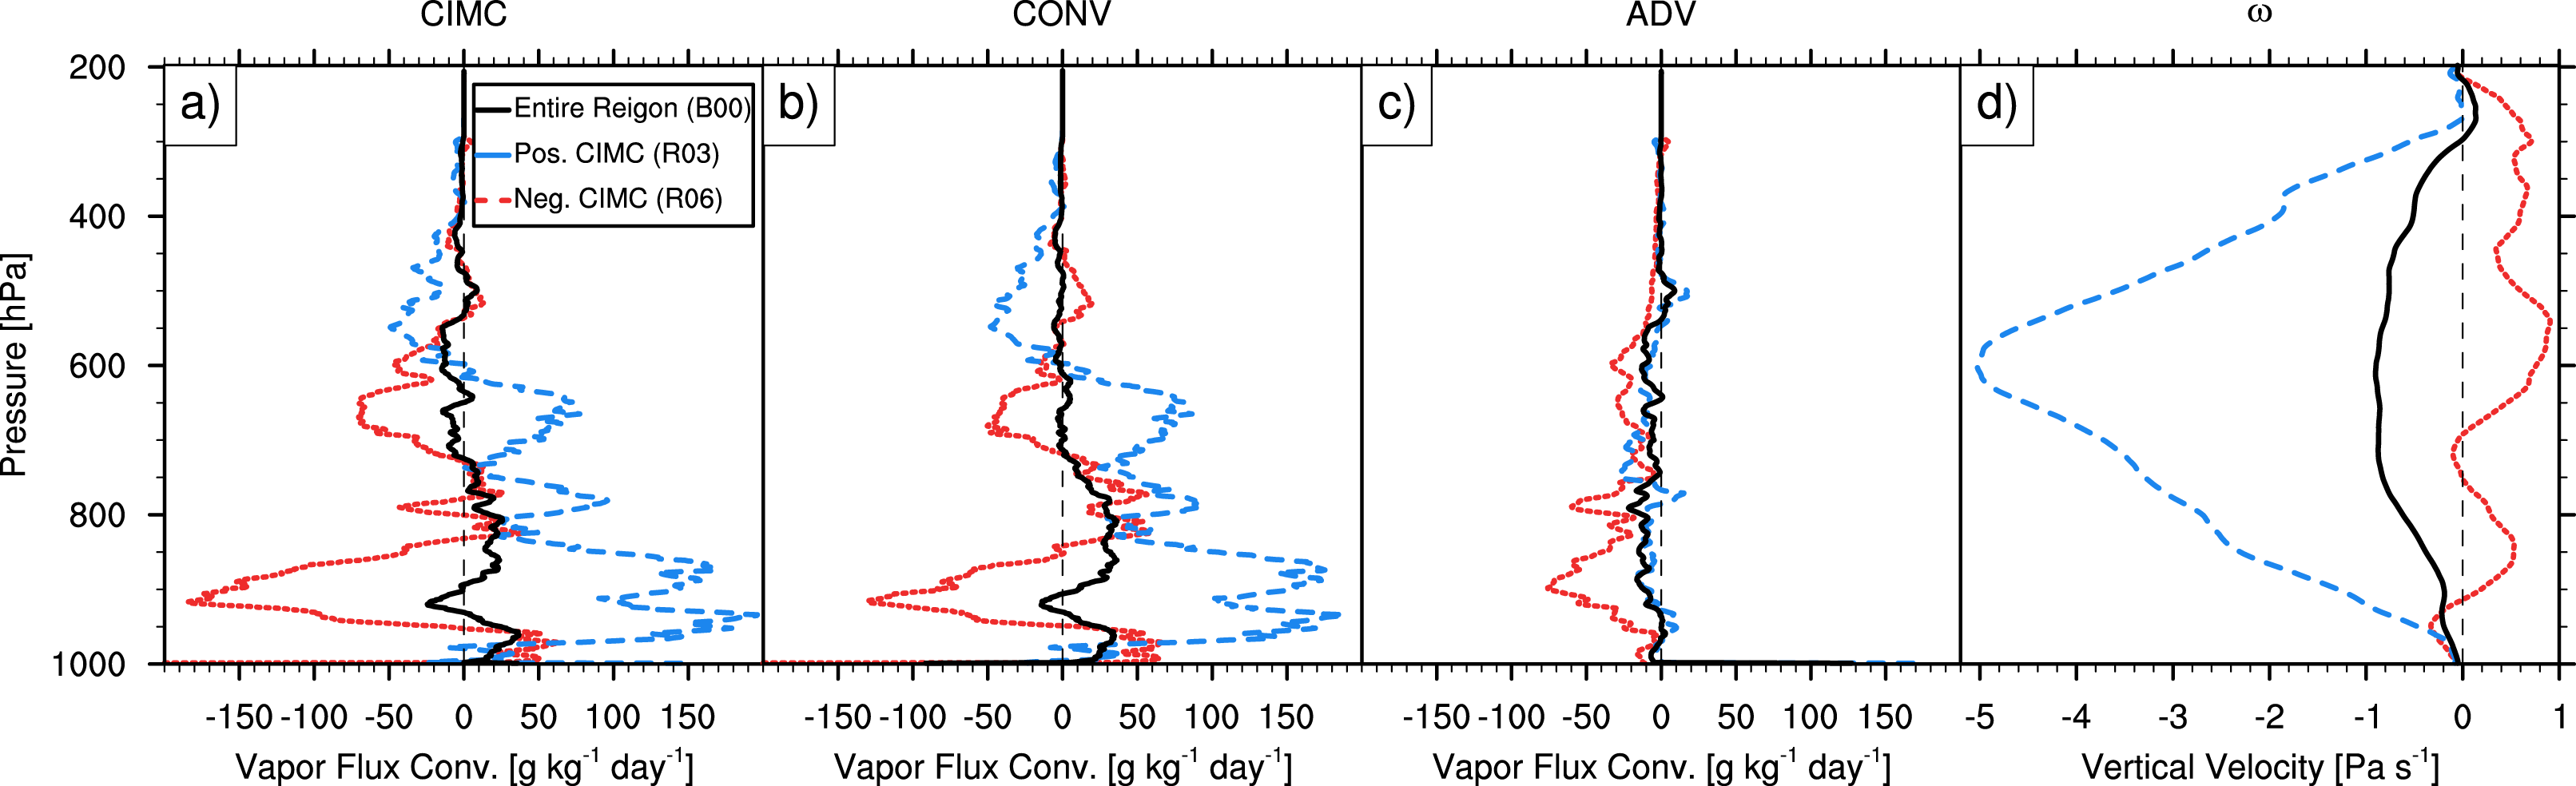
Figure 2. Kinematic diagnostic profiles derived from the G-IV dropsondes comprising the entire budget region (B00, black) and subregions with the most positive CIMC (R03, dashed blue) and most negative CIMC (R06, dotted red) , as defined in Fig. 10 and Table 4 (see publication): (a) mass-balanced horizontal moisture convergence (g kg-1 day-1), (b) mass-balanced change in moisture from horizontal dynamical convergence (g kg-1 day-1), © mass-balanced horizontal moisture advection (g kg-1 day-1), and (d) pressure vertical velocity (Pa s-1). (Figure 11 from Norris et al., 2020).

Norris, J.R., F.M. Ralph, R. Demirdjian, F. Cannon, B. Blomquist, C.W. Fairall, J.R. Spackman, S. Tanelli, and D.E. Waliser, 2020: The Observed Water Vapor Budget in an Atmospheric River over the Northeast Pacific. J. Hydrometeor., 21, 2655-2673, https://doi.org/10.1175/JHM-D-20-0048.1.

CW3E Publication Notice: Hydrometeorological Characteristics of Ice Jams on the Pemigewasset River in Central New Hampshire

CW3E Publication Notice

Hydrometeorological Characteristics of Ice Jams on the Pemigewasset River in Central New Hampshire

November 15, 2020

Matthew Sanders, M.S., of Plymouth State University, has published a paper in the Journal of Hydrometeorology, along with his advisor, CW3E affiliate Jason M. Cordeira of Plymouth State University, and Nicholas D. Metz of Hobart and William Smith Colleges (Sanders et al., 2021). This study contributes to the goals of CW3E’s 2019-2024 Strategic Plan to support monitoring and projections of climate variability and change by advancing understanding and projections of extreme precipitation events.

The study considers two impactful ice jams, both of which resulted in flooding, in order to illustrate the hydrometeorological characteristics of ice jam events on the Pemigewasset River in central New Hampshire. The two case studies show the importance of short term antecedent conditions to the ultimate impacts of the ice jams. Antecedent conditions from each event, one which included a long melting period with low precipitation and the other which included a short melting period with high precipitation, contributed to the formation of the ice jams, along with the presence of an atmospheric river (AR). In addition to the case studies highlighted, a longer period of record (>25 years) with composite analysis is employed in order to understand the circulation patterns associated with these events. Composite analysis of 20 ice jam events during 1981–2019 allows for the construction of a schematic summarizing common synoptic-scale characteristics (Figure 1). All but one of the events were preceded by environments characterized by ARs along the U.S. East Coast. Five general phases associated with ice jams and flooding were identified and described in order to support situational awareness, beginning 1-2 weeks before the event with cold temperatures and periodic snow accumulations, and continuing through a few days before the event with warming temperatures and some melting of existing snowpack. Directly before the event, a midlatitude cyclone almost always associated with an AR brings periods of heavy precipitation. At the event, the ice aggregates and blocks rising river flow; and just after the event, there is potential for freezing in place especially if a cold front passes. This work provides an important assessment of the synoptic-scale characteristics and effect of short term antecedent conditions before ice jams that cause significant local impacts in the Northeast United States.

Figure 1: Figure 13 in Sanders et al., 2020: Overview schematic for meteorological features associated with ice jams on the Pemigewasset River in Plymouth, New Hampshire. The schematic highlights 1) the location of Plymouth (yellow star), 2) upper-level (e.g., 300-hPa) jet streaks (“J”; purple shading with dashed contours), 3) upstream trough in mid-level (e.g., 500-hPa) geopotential height contours (solid black lines), 4) warm-period temperature anomaly (red oval and shading), 5) tropospheric moisture (green shading for IWV values >25 mm) and moisture transport (black arrow representing AR and corridor of IVT values >600 kg m−1s−1), 6) surface frontal features, and 7) surface cyclone and anticyclone locations (red “L” and blue “H” symbols, respectively) and associated lower-tropospheric flow (red arrows).

Sanders, M. C., J. M. Cordeira, and N. D. Metz, 2020: Hydrometeorological Characteristics of Ice Jams on the Pemigewasset River in Central New Hampshire. J. Hydrometeorology, 21, 2923-2942 https://doi.org/10.1175/JHM-D-20-0027.1 .

CW3E AR Update: 12 November 2020 Outlook

CW3E AR Update: 12 November 2020 Outlook

November 12, 2020

Click here for a pdf of this information.

Active weather pattern expected to bring heavy rainfall and snowfall to portions of the Western U.S.

  • A series of storms and landfalling ARs are forecast to bring significant precipitation to portions of Northern California and the Pacific Northwest over the next 7 days
  • AR 4/AR 5 conditions (based on the Ralph et al. 2019 AR Scale) are possible over coastal Oregon and Washington in association with the second landfalling AR
  • The highest 7-day precipitation amounts (5–10 inches) are forecast over the Pacific Coast Ranges and Cascade Mountains
  • More than 2 feet of snow is possible in the higher elevations of the Washington Cascades during the next 48 hours

Click images to see loops of GFS IVT & IWV forecasts

Valid 0000 UTC 12 November – 1200 UTC 19 November 2020


Summary provided by C. Castellano, C. Hecht, B. Kawzenuk, and F. M. Ralph; 12 November 2020

*Outlook products are considered experimental

CW3E AR Update: 10 November 2020 Outlook

CW3E AR Update: 10 November 2020 Outlook

November 10, 2020

Click here for a pdf of this information.

An active pattern is forecast to bring multiple landfalling atmospheric rivers to the Pacific Northwest and Northern California

  • The first AR is forecast to make landfall on 13 November, though there is currently large ensemble uncertainty in onset and overall duration of AR conditions
  • The second AR is forecast to make landfall over the Pacific Northwest on 15 November but is also associated with large ensemble and model-to-model uncertainty
  • The GEFS control member is currently suggesting that first AR could bring AR 2 conditions to Northern CA and Southern OR while the second AR could bring AR 4 conditions to Southern OR
  • The NOAA Weather Prediction Center is currently forecasting >10 inches of precipitation over the high elevations of the Coastal, Olympic, and Cascade Mountain Ranges during the next 7 days.

Click images to see loops of GFS IVT & IWV forecasts

Valid 0600 UTC 10 November – 0600 UTC 20 November 2020


Summary provided by C. Hecht, B. Kawzenuk, C. Castellano, J. Kalansky, and F. M. Ralph; 10 November 2020

*Outlook products are considered experimental

CW3E Hosts Fourth Yampa Basin Rendezvous Webinar of 2020: Exploring Uncertainty and Climate Change Impacts in the Yampa River Basin

CW3E Hosts Fourth Yampa Basin Rendezvous Webinar of 2020: Exploring Uncertainty and Climate Change Impacts in the Yampa River Basin

November 8, 2020

The Yampa River is one of the wildest remaining major tributaries of the Colorado River, and provides crucial water supplies to local stakeholders and to locations as far removed as Arizona and Southern California. A multitude of environmental and societal factors are expected to be affected by climate change in the Yampa River Basin, and are pertinent to other watersheds around the American West.

This summer, CW3E and our partners at Colorado Mountain College, Friends of the Yampa, Yampa Valley Sustainability Council, Steamboat Ski and Resort Corporation, and Vacasa, among others, have virtually come together for four webinars making up the third annual Yampa Basin Rendezvous (YBR). YBR 2020 is a series of four interactive webinars examining the Yampa River Basin through the lens of climate change and seasonal variability. The webinars include talks by regional experts and lively discussions.

The first webinar was held on June 4, 2020, introducing the series and providing an overview of the past year in the Yampa Basin with an eye to this year’s theme of Seasonal Variability. The panelists included Marty Ralph, CW3E Director; Kent Vertrees, with Friends of the Yampa and Steamboat Powdercats; and Nathan Stewart, Associate Professor of Sustainability Studies at Colorado Mountain College.

The second webinar of YBR 2020 was held on July 9, 2020. Webinar 2 was a panel discussion on Changes in Measurement with a Changing Climate, addressing what our measurement data are currently showing and ways we can adapt our strategies to be more effective. The panelists were Mike Dettinger, Visiting Researcher at Scripps Institution of Oceanography; Jeff Deems, Research Scientist with National Snow and Ice Data Center; and Gannet Hallar, Associate Professor of Atmospheric Science at University of Utah.

The third webinar of YBR 2020 was held on September 17th. Webinar 3 focused on the changes we are seeing from shifting seasons and precipitation and how these changes are impacting our local and statewide watershed and forest health. Our panelists were Russ Schumacher, Associate Professor of Atmospheric Science at Colorado State University, Director of the Colorado Climate Center, and Colorado’s State Climatologist; David Stahle, Distinguished Professor of Geosciences at University of Arkansas; and Courtney Peterson, Adaptive Silviculture for Climate Change (ASCC) Coordinator for the Northern Institute of Applied Climate Science.

The fourth webinar of YBR 2020 was held on October 22nd. This webinar delved into the uncertainty and impacts of seasonal variability on our economy, environment and way of life in the Yampa River Basin. Our panelists included David Anderson, Program Director for the Colorado Natural Heritage Program; Todd Hagenbuch, County Director and Agricultural Agent for CSU Extension; and Aneesh Subramanian, Assistant Professor of Atmospheric and Oceanic Sciences, UC Boulder.

The first, second, third and fourth webinars are now available to view online.

These four webinars were part of a larger effort to connect graduate students, post-doctoral scholars, researchers, staff, and faculty from CW3E to the local communities of river basins throughout the west, to share knowledge regarding climate variability and change that has impacts on the environment, people and the economy.

Panelists for Yampa Basin Rendezvous 2020 Webinar 4, held on October 22, 2020.

CW3E AR Update: 5 November 2020 Outlook

CW3E AR Update: 5 November 2020 Outlook

November 5, 2020

Click here for a pdf of this information.

First significant precipitation event of the season likely in California and the Four Corners Region

  • A shortwave trough and an associated AR are forecast to bring significant precipitation to portions of California and the Four Corners Region over the next several days
  • AR 2/AR 3 conditions (based on the Ralph et al. 2019 AR Scale) are possible in south-central Arizona
  • The highest precipitation amounts (1–3 inches) are forecast over far northern California, the Sierra Nevada, coastal Southern California, and across the higher terrain in central Arizona, Utah, and western Colorado
  • Significant snowfall is also possible in the Sierra Nevada and San Juan Mountains

Click images to see loops of GFS 500-hPa Absolute Vorticity & IVT forecasts

Valid 1200 UTC 5 November – 1200 UTC 9 November 2020


Summary provided by C. Castellano, C. Hecht, J. Kalansky, B. Kawzenuk, and F. M. Ralph; 5 November 2020

*Outlook products are considered experimental

Four CW3E Researchers Honored with CA DWR’s Award For Climate Science Service

Four CW3E Researchers Honored with CA DWR’s Award For Climate Science Service

November 5, 2020

During the annual Winter Outlook Workshop (WOW), sponsored by the California Department of Water Resources (DWR) and hosted virtually by CW3E on Nov 3-5, 2020, CW3E’s early career researchers, Dr. Anna Wilson, Dr. Julie Kalansky, Dr. Michael DeFlorio, and Dr. Peter Gibson, were recognized for their Climate Science Service. The awards were a tribute to their continued contribution and collaboration with DWR on subseasonal to seasonal forecasting and climate science related research and innovations. It is an honor to have the work of our scientists recognized for their role in the development of new technologies for water and flood-risk management. Thank you, DWR! Read the full press release here.

From Top Left: Dr. Anna Wilson, Dr. Julie Kalansky, Dr. Mike DeFlorio and Dr. Peter Gibson.