2020 North American Monsoon Recap

2020 North American Monsoon Recap

October 22, 2020

Click here for a pdf of this information.

2020 North American Monsoon season characterized by extreme heat and lack of rainfall

  • The North American Monsoon (NAM) refers to a shift in the synoptic-scale wind pattern that transports low-to-midlevel moisture from the Eastern Pacific, Gulf of California, and Gulf of Mexico into the southwestern US during summer
  • The NAM is an important source of annual precipitation for parts of the southwestern US
  • Unlike the stronger Indian Monsoon, the NAM is characterized by episodic bursts of moisture transport and rainfall
  • Persistent circulation anomalies during July–September 2020 resulted in an abnormally inactive monsoon season
  • The Southwest climate region experienced its warmest and driest July–September period on record
  • Anomalously warm and dry summer weather further exacerbated existing drought conditions over the western US


Summary provided by C. Castellano, J. Cordeira, J. Kalansky, N. Oakley, and F. M. Ralph; 22 October 2020

CW3E Publication Notice: A Climatology of Atmospheric Rivers and Associated Precipitation for the Seven US National Climate Assessment Regions

CW3E Publication Notice

A Climatology of Atmospheric Rivers and Associated Precipitation for the Seven US National Climate Assessment Regions

October 21, 2020

CW3E affiliates Duane Waliser, Bin Guan, and Andrew Martin joined Portland State PhD candidate and AR colloquium summer school attendee, Emily Slinskey, along with academic advisor Paul Loikith, on a recently published paper, titled “A Climatology of Atmospheric Rivers and Associated Precipitation for the Seven US National Climate Assessment Regions.” The article was published in the Journal of Hydrometeorology and will be featured in the November 2020 issue of the Bulletin of the American Meteorological Society.

Well-documented across the western United States (US), ARs are known for their important role in water resources as well as hydrometeorological extremes. However, research has shown that ARs are common and impactful in many regions across the Continental Unites States (CONUS; Fig. 1). To expand our understanding and documentation of regional AR impacts, the authors applied an objective AR detection algorithm to global reanalyses to enable a pointwise and regionally aggregated annual and seasonal understanding of AR frequency, physical characteristics, and impacts across the CONUS. Results are summarized over the seven US National Climate Assessment (NCA) regions to facilitate further incorporation of ARs and their impacts into ongoing and future climate assessments at regional scales. CW3E collaborators and affiliates that are authors on this paper are contributing to the goals set by CW3E in the 2019-2024 Strategic Plan to support “Atmospheric River Research and Applications” and “Monitoring and Projections of Climate Variability and Change”, especially as it applies to the National Climate Assessments.

Seasonal climatologies of AR frequency reveal ARs in the Northwest and Southwest are most common in the winter and fall, with greater than 10% of days having a detected AR. Although considerably less studied, AR occurrences east of the Rocky Mountains are observed across the annual cycle with notable maxima of greater than 12% in the Southeast in the winter and 10% in the Central US during the summer and shoulder seasons. Composites of IVT for cities exhibiting different AR climatologies across the CONUS further highlight regional variability among AR geometries and associated water vapor pathways.

In the West, coastal mountain ranges act as an efficient lifting mechanism for the moisture in ARs, resulting in ample precipitation and preventing most ARs from penetrating inland. Higher levels of background moisture and a more diverse array of precipitation triggering mechanisms in the East likely explain differences in AR occurrence and associated precipitation impacts compared to the West. Investigating AR IVT magnitude reveals that the Northeast experiences the strongest ARs, with seasonal average values upwards of 450 kg m-1 s-1. Detected ARs linked with high resolution precipitation measurements show that ARs are responsible for up to 50% of the total precipitation that falls over parts of the Northwest and Southwest during the fall and winter as well as across the Midwest and Southeast during the spring. Together, these results demonstrate that ARs are strong and impactful in regions beyond the western US.

Analysis of AR-associated precipitation shows that a substantial proportion of extreme precipitation days, defined as the highest 5% of three-day precipitation totals, are associated with ARs over many parts of the CONUS, including the eastern US (Fig. 1). However, the seasonality of linked AR extreme precipitation days is starkly different across regions. For example, across the Northwest close to 75% of extreme precipitation days are linked to ARs in the winter, while across the Midwest and southern Great Plains ARs play an important role during the summer with over 50% of extreme precipitation days related to an AR. These findings demonstrate the importance of ARs in regional weather, climate, and hydrology across the CONUS. Results also provide a target for climate model validation and a benchmark for quantifying projections of change in future AR characteristics under global warming.

Figure 1. AR extreme precipitation fraction (% of days) calculated as the number of linked 95th percentile extreme precipitation AR days relative to the total number of extreme precipitation days between 1981-2016 at each grid cell. Results are for (a) December, January, and February; (b) March, April, and May; (c) June, July, and August; and (d) September, October, and November.

Slinskey, E.A., P.C. Loikith, D.E. Waliser, B. Guan, and A. Martin, 2020: A Climatology of Atmospheric Rivers and Associated Precipitation for the Seven US National Climate Assessment Regions. J. Hydrometeor., 21, 2439-2456, https://doi.org/10.1175/JHM-D-20-0039.1.

CW3E Publication Notice: Data Gaps within Atmospheric Rivers over the Northeastern Pacific

CW3E Publication Notice

Data Gaps within Atmospheric Rivers over the Northeastern Pacific

October 20, 2020

CW3E data assimilation researcher, Minghua Zheng, along with other researchers from CW3E (Luca Delle Monache, F. Martin Ralph, Anna W. Wilson, and Forest Cannon), NOAA/NCEP/EMC (Xingren Wu and Vijay Tallapragada), Scripps (Bruce Cornuelle, Jennifer S. Haase, and Matthew Mazloff), and the University of Colorado at Boulder (Aneesh Subramanian), published a paper in Bulletin of the American Meteorological Society, titled “Data Gaps within Atmospheric Rivers over the Northeastern Pacific” (Zheng et al. 2020). As part of CW3E’s 2019-2024 Strategic Plan to support Atmospheric River Research and Applications, CW3E seeks to enhance global AR monitoring through a transformative modernization of atmospheric measurements over the Pacific and in the western United States. In particular, this study assesses the data availability within ARs over the northeastern Pacific based on the observations assimilated by the NCEP operational GFS. It found that a significant data void exists in the lower atmosphere during AR events over the northeastern Pacific. When available, AR Reconnaissance (Recon) data provide the majority of direct observations within oceanic ARs. This study is a fundamental step to inform future AR Recon targeting plans and data denial experiments by assessing how AR Recon data are augmenting the existing observation network. Ultimately, this work supports ongoing collaborations involving CW3E, NOAA, NRL, U.S. Army Corps of Engineers, NCAR, and ECMWF.

In this work, the available observations for ARs are partitioned into non-radiance data and radiance data. Non-radiance data include conventional observations, GPS Radio Occultation (RO), satellite derived winds (SATWND), scatterometer ocean surface winds, and radar vertical azimuth display (VAD) wind profile. Radiance data include all the satellite radiance types assimilated by GFS. The radiance data are further grouped into clear-sky radiances and all-sky radiances. A data gap exists from near the surface to middle troposphere, where most of the water vapor transport is concentrated within an AR object (Figure 1a). Most conventional observations are primarily land based and unavailable over the Pacific Ocean. Satellite derived winds are mainly usable in the upper troposphere due to the presence of upper-level clouds associated with ARs. Commercial aircraft typically do not fly in the lower to middle troposphere. AR Recon dropsonde data can largely fill the observation gaps from near the surface to the middle troposphere (Figure 1b), where they contribute 76.8% of the direct temperature, 99.9% of the humidity, and 48.0% of the wind observations in an AR object (see Table 4 in Zheng et al. 2020). The all-sky radiance data typically under-samples the vertical structure between 400 and 900 hPa, and clear-sky radiance data are unavailable from the surface to 300 hPa (Figure 1c). Furthermore, all-sky microwave radiances are often either rejected over precipitating areas or assigned small weights during assimilation by the model (see Figures 11-12 in Zheng et al. 2020). Dropsondes add critical details about the vertical properties of stability and saturation in this region that often impact cyclogenesis (Figures 1c-d).

AR Recon dropsondes and supplemental drifting buoys and airborne RO data are not only filling the observation gap in the lower to middle levels within and above an AR, but also provide high-quality wind and moisture data over the highest wind- and moisture-sensitive regions where initial errors will most likely trigger forecast errors in the landfalling ARs and the associated precipitation over the western U.S. (Figure 2).

Figure 1. (Figure 13 in Zheng et al. 2020) Three-dimensional illustration of observation distributions for non-radiance data (a) without and (b) with AR Recon flight-level and dropsonde data (black filled circles); (c-d) are the radiance locations (colored markers) and their final errors (colors on each marker) along a flight path A-B (c) without and (d) with AR Recon dropsondes. The cyan dots on panel (d) are the raw dropsonde observations. The black dots are the AR Recon flight-level and dropsonde data used in the operational GFS. The coordinates for A and B are (49.9oN, 144oW) and (39.2oN, 141.4oW). This figure is based on the observations for 2016IOP1. The grey and pink shaded on (a-b) are the isosurface for 50?h (25 kg m-1 s-1) and 95?h (80 kg m-1 s-1) layer IVT values, respectively. The surface shades with black contours are for the total IVT value starting from 250 kg m-1 s-1 with an increment of 250.

Figure 2. (Figure 14 in Zheng et al. 2020) A schematic summary of the AR Recon observations relative to key meteorological features and structure of an AR over the northeastern Pacific Ocean, and the adjoint sensitivity of West Coast landfalling ARs to initial condition winds and moisture 1-2 days ahead. Panel (a) a plan-view representation of the AR and the surrounding meteorological features. IVT amplitude is shown by color fill (kg m-1 s-1) with IVT exceeding 250 kg m-1 s-1 in grey indicating the AR boundaries. The position of the cross section shown in (b)-(d) is denoted by the dashed line A–B. (b) Vertical cross-section of key meteorological features in and near an AR over the northeastern Pacific Ocean. Panels (a)-(b) are adapted from Ralph et al. (2017). © American Meteorological Society. Used with permission. (c) Adjoint sensitivity of forecasts of West Coast landfalling ARs at 1-2 days lead time to initial condition errors in wind and moisture offshore summarized from Reynolds et al. (2019). The background is same with (b). (d) The distributions of AR Recon observations over the northeastern Pacific Ocean during AR conditions. The supplemental buoys and ARO data so far have not been assimilated by GFS/GDAS.

Zheng, M., Monache, L. D., Wu, X., Ralph, F.M., Cornuelle, B., Tallapragada, V., Haase, J.S., Wilson, A.M., Mazloff, M., Subramanian, A.C., Cannon, F, 2020. Data Gaps within Atmospheric Rivers over the Northeastern Pacific. Bulletin of the American Meteorological Society, in press. https://doi.org/10.1175/BAMS-D-19-0287.1.

CW3E Explores Uncertainty and Climate Change Impacts in the Yampa River Basin Upcoming Webinar

CW3E Explores Uncertainty and Climate Change Impacts in the Yampa River Basin Upcoming Webinar:

Thursday, October 22, 11-12:30 Mountain Time

October 22, 2020

The Yampa River is one of the wildest remaining major tributaries of the Colorado River, and provides crucial water supplies to local stakeholders and to locations as far removed as Arizona and Southern California. A multitude of environmental and societal factors are expected to be affected by climate change in the Yampa River Basin, and are pertinent to other watersheds around the American West.

This summer, CW3E and our partners at Colorado Mountain College, Friends of the Yampa, Yampa Valley Sustainability Council, Steamboat Ski and Resort Corporation, and Vacasa, among others, have virtually come together for the third annual Yampa Basin Rendezvous (YBR). YBR 2020 is a series of four interactive webinars examining the Yampa River Basin through the lens of climate change and seasonal variability. The webinars include talks by regional experts and lively discussions.

The first webinar was held on June 4, 2020, introducing the series and providing an overview of the past year in the Yampa Basin with an eye to this year’s theme of Seasonal Variability. The panelists included Marty Ralph, CW3E Director; Kent Vertrees, with Friends of the Yampa and Steamboat Powdercats; and Nathan Stewart, Associate Professor of Sustainability Studies at Colorado Mountain College.

The second webinar of YBR 2020 was held on July 9, 2020. Webinar 2 was a panel discussion on Changes in Measurement with a Changing Climate, addressing what our measurement data are currently showing and ways we can adapt our strategies to be more effective. The panelists were Mike Dettinger, Visiting Researcher at Scripps Institution of Oceanography; Jeff Deems, Research Scientist with National Snow and Ice Data Center; and Gannet Hallar, Associate Professor of Atmospheric Science at University of Utah.

The third webinar of YBR 2020 was held on September 17th. Webinar 3 focused on the changes we are seeing from shifting seasons and precipitation and how these changes are impacting our local and statewide watershed and forest health. Our panelists were Russ Schumacher, Associate Professor of Atmospheric Science at Colorado State University, Director of the Colorado Climate Center, and Colorado’s State Climatologist; David Stahle, Distinguished Professor of Geosciences at University of Arkansas; and Courtney Peterson, Adaptive Silviculture for Climate Change (ASCC) Coordinator for the Northern Institute of Applied Climate Science. The first, second, and third webinars are now available to view online.

This week, on Thursday, October 22nd, 11-12:30 (Mountain Time), we will have the fourth and last webinar of YBR 2020, hosted virtually on Zoom. This webinar will delve into the uncertainty and impacts of seasonal variability on our economy, environment and way of life in the Yampa River Basin. Our panelists will include David Anderson, Program Director for the Colorado Natural Heritage Program; Todd Hagenbuch, County Director and Agricultural Agent for CSU Extension; and Aneesh Subramanian, Assistant Professor of Atmospheric and Oceanic Sciences, UC Boulder. Register here!

This event is part of a larger effort to connect graduate students, post-doctoral scholars, researchers, staff, and faculty from CW3E to the local communities of river basins throughout the west, to share knowledge regarding climate variability and change that has impacts on the environment, people and the economy.

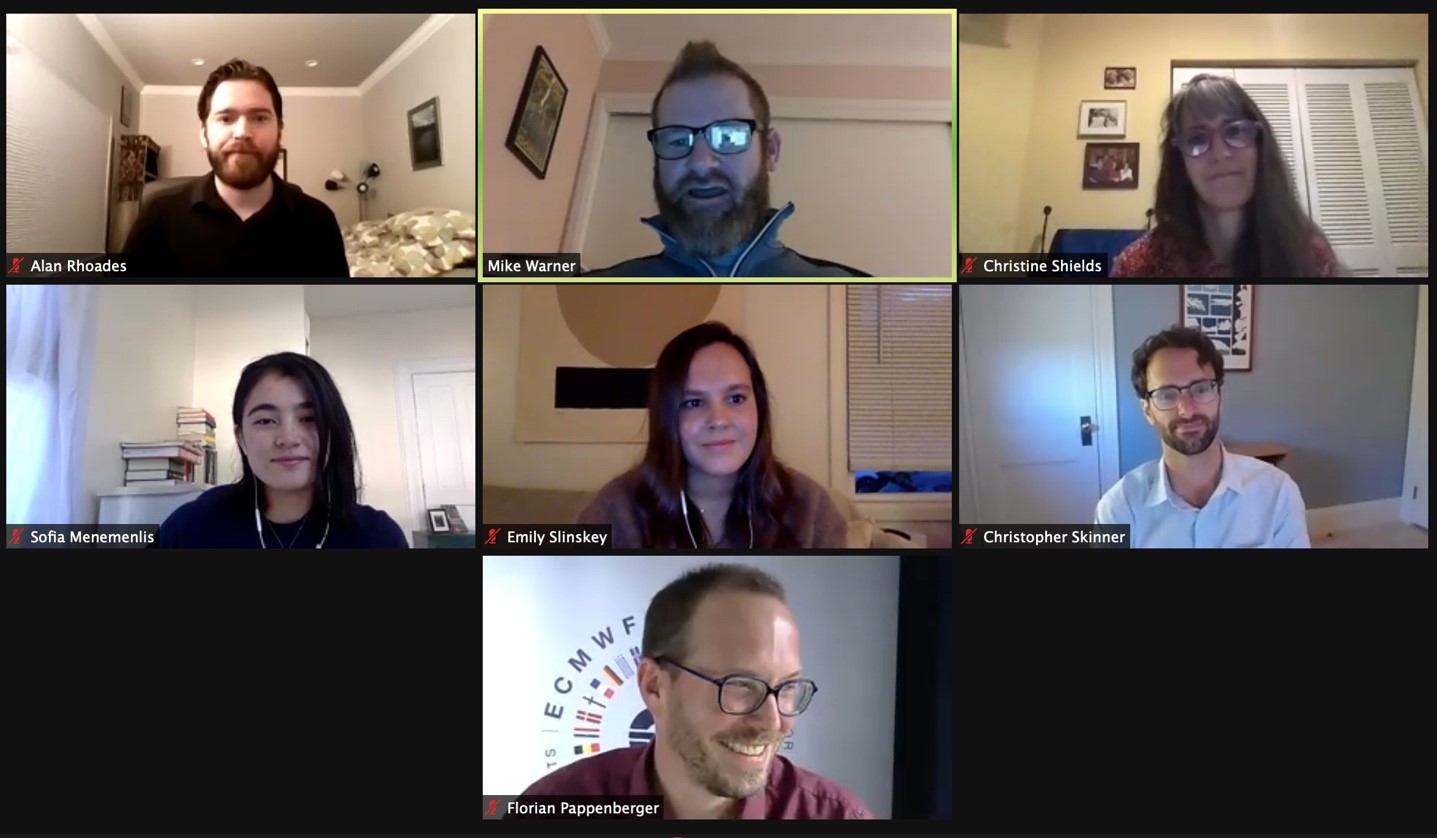
Panelists for Yampa Basin Rendezvous 2020 Webinar 3, held on September 17, 2020.


CW3E Publication Notice: Observations and Predictability of a High-Impact Narrow Cold Frontal Rainband over Southern California on 2 February 2019

CW3E Publication Notice

Observations and Predictability of a High-Impact Narrow Cold Frontal Rainband over Southern California on 2 February 2019

October 16, 2020

A group of CW3E researchers, led by Forest Cannon, used an in-depth case study of a narrow cold frontal rainband (NCFR) to assess the predictability of various aspects of these features and explore potential early warning signals that an NCFR is likely to develop.

NCFRs are narrow bands of high-intensity rainfall that are parallel to and occur in the vicinity of the cold front in a storm. They are typically only a few kilometers wide and extend tens to 100s of km in length, and are broken into “gap and core” structures of light rainfall (gaps) and intense rainfall (cores; Fig 1a). NCFRs are also characterized by their relatively shallow convection (<3-5 km deep), driven by strong low-level convergence along the front.

Figure 1. : (a) NEXRAD base (0.468) radar reflectivity at 2200 UTC and (b) West-WRF-Exp simulated composite reflectivity at 2300 UTC 2 Feb 2019 from the control simulation. The control simulation NCFR lagged behind the observed NCFR by ~1 h. The San Diego NEXRAD site is marked by a red circle.

This work was motivated by the fact that NCFRs have been associated with numerous extreme precipitation and flash flooding or debris flow events in California. Recent observational and theoretical studies have described NCFRs. In this work, we wanted to take the next step forward and gain insight to representation of NCFRs in the weather models that are used to forecast them. Here, we use WRF as well as novel observations from an Atmospheric River Reconnaissance mission and CW3E field campaign to evaluate model performance in representing an NCFR that impacted southern California on 2 February 2019.

We found that rapid cyclogenesis (rapidly falling sea level pressure (SLP)) was an indicator that NCFR development was likely in this event. Individual GEFS ensemble members captured the SLP drop five days in advance of NCFR landfall, and the observed SLP drop was within the ensemble spread three days in advance of NCFR landfall. This provides an indication of a potential source of situational awareness at long-lead times (3-5 days) for these features.

Figure 2. : Dropsondes in the cold sector behind the front (blue line) and in the warm sector ahead of the front (red line) and the corresponding West-WRF-Exp ensemble member (small open circles) and mean (large filled circle) profiles for (a) temperature, (b) water vapor mixing ratio, (c) wind speed, (d) vapor flux, and (e) wind direction, plotted on model levels.

In the WRF simulation, which is used to resolve finer details of the event at shorter lead times, all 21 ensemble members produced an NCFR, though there were variations in the structure, timing, intensity, and orientation. This indicates that the development of this NCFR in West-WRF was insensitive to model physics or sub-grid-scale errors. We compared the dropsonde observations to the model output—ahead of (in warm sector) and behind (in cold sector) of the cold front. For the variables examined (temperature, mixing ratio, wind speed and direction, and vapor flux) the ensemble mean gave a reasonable approximation of the dropsonde observations, indicating WRF accurately captures some of the key physical processes that drive NCFR evolution (Fig. 2).

The results are encouraging for the use of mesoscale model forecasts for NCFRs at multi-day lead times, though the issues remain of timing, location, and intensity errors. As next steps, we will extend this work to a larger event sample size as well as assess performance of operational forecast models for NCFRs.

This work addresses several priority areas in the CW3E 2019-2024 strategic plan. Atmospheric River Research and Applications: NCFRs often occur in conjunction with ARs. Intense convection in an NCFR likely influences characteristics and predictability of AR-related precipitation, thus improving model performance with respect to NCFRs will support the advancement of AR science. Modeling Capabilities in the Western US: This research assesses model performance and gives indications of potential for model improvement with respect to extreme precipitation. Forecast Informed Reservoir Operations: NCFRs produce short-duration, high-intensity precipitation. Reservoirs operations that are sensitive to “flashy” runoff will benefit from improved understanding and forecasting of NCFRs.

Read the full manuscript in Weather and Forecasting here: https://doi.org/10.1175/WAF-D-20-0012.1

Cannon, F., Oakley, N.S., Hecht, C.W., Michaelis, A., Cordeira, J.M., Kawzenuk, B., Demirdjian, R., Weihs, R., Fish, M.A., Wilson, A.M. and Ralph, F.M., 2020: Observations and Predictability of a High-Impact Narrow Cold-Frontal Rainband over Southern California on 2 February 2019. Wea. Forecasting, 35, 2083-2097, https://doi.org/10.1175/WAF-D-20-0012.1.

CW3E AR Update: 14 October 2020 Outlook

CW3E AR Update: 14 October 2020 Event Summary & Outlook

October 14, 2020

Click here for a pdf of this information.

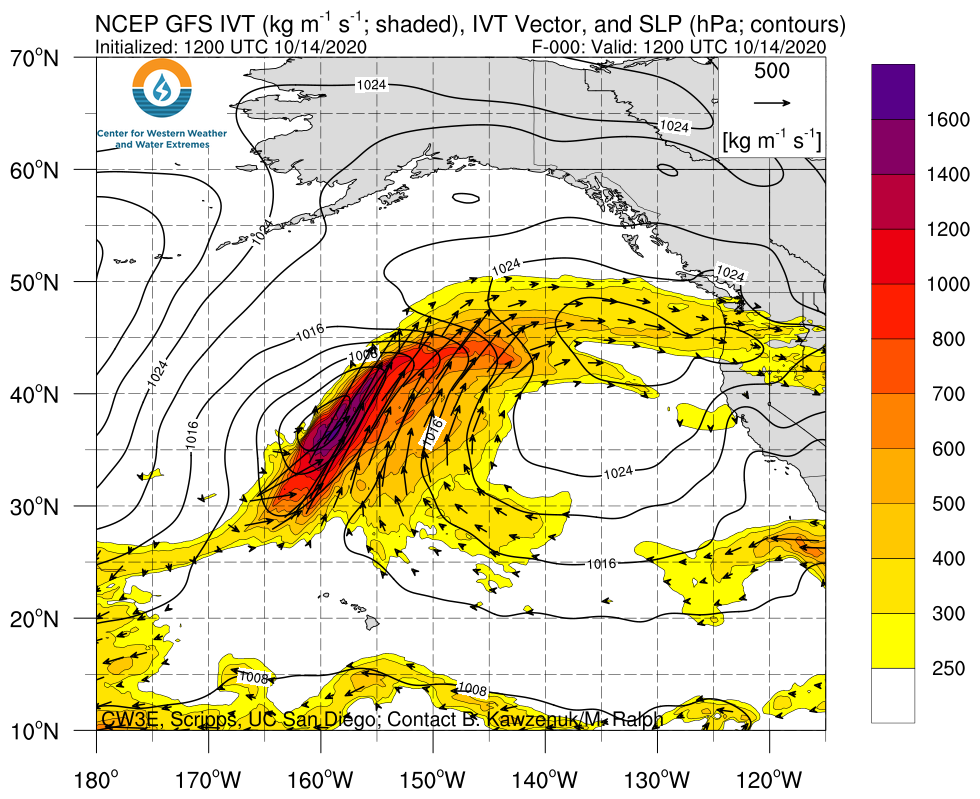
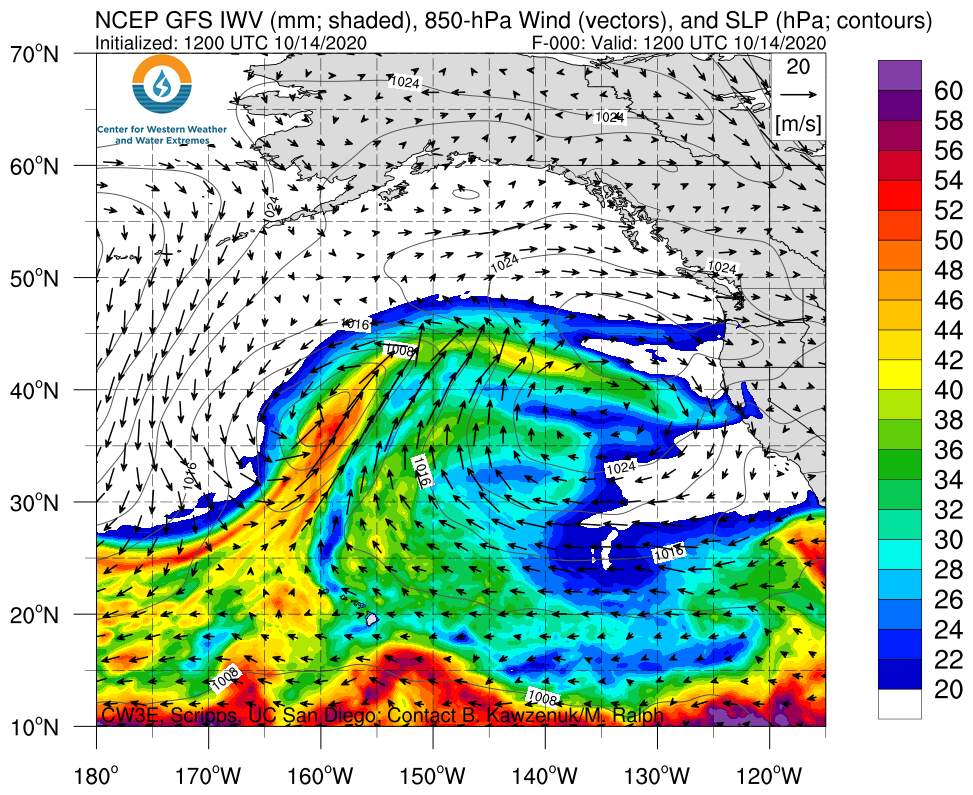
Active weather pattern to continue across the Pacific Northwest

  • A series of landfalling ARs resulted in heavy rainfall and snowfall across the Northwestern US between 9 Oct and 14 Oct
  • The ongoing AR is expected to produce AR 4/AR 5 conditions (based on the Ralph et al. 2019 AR Scale) along the coast of Washington and Oregon
  • Total estimated 7-day precipitation ending 14 Oct exceeded 5 inches over the northern Oregon Coast Ranges, Olympic Mountains, and Cascades, with some locations receiving more than 10 inches
  • Significant snowfall also occurred over portions of the Washington Cascades and Rocky Mountains in Idaho and Montana
  • Additional AR activity and precipitation are forecast across the Pacific Northwest during the next several days

Click images to see loops of GFS IVT/IWV analyses and forecasts

Valid 1200 UTC 14 October – 1200 UTC 24 October 2020


Summary provided by C. Castellano, C. Hecht, J. Kalansky, N. Oakley, and F. M. Ralph; 14 October 2020

*Outlook products are considered experimental

CW3E Publication Notice: Linking Mesoscale Meteorology with Extreme Landscape Response: Effects of an NCFR

CW3E Publication Notice

Linking Mesoscale Meteorology with Extreme Landscape Response: Effects of an NCFR

October 13, 2020

CW3E researcher Nina Oakley, in collaboration with USGS researchers Brian Collins (lead author), Jonathan Perkins, Amy East, Skye Corbett, and DRI researcher Ben Hatchett, use an in-depth case study of a localized landslide event in the Tuolumne River basin to demonstrate the importance of mesoscale meteorology in describing extreme landscape response.

Figure 1. Oblique image of the hundreds of shallow landslides within the Tuolumne River canyon north of Groveland, California, caused by the 22 March 2018 NCFR. Inset image shows view from river level of the area encompassed by the black rectangle. Oblique image from GeoEye taken on 17 April 2018.

On March 22, 2018, intense rainfall initiated more than 500 shallow landslides (Fig 1) in a narrowly focused area of the Tuolumne River canyon near the town of Groveland, in the foothills of the Sierra Nevada. The landslides generated more sediment in one day than the river would normally transport in one year, raising water quality and reservoir sedimentation concerns. The intense rainfall also damaged parts of San Francisco’s water delivery system downstream of Hetch Hetchy; regional infrastructure impacts resulting from this storm were estimated at $74 million.

A strong atmospheric river (AR) produced roughly 100-150 mm (4-6 in) of rainfall in the 30 hours preceding the high-intensity rainfall event. As the AR exited the region, a narrow band of high intensity rainfall collocated with a cold front, known as a “narrow cold frontal rainband”, or NCFR (Fig 2), moved southeastward along the Sierra Nevada and stalled in the vicinity of Groveland and the Tuolumne River canyon. NCFRs are typically a few miles wide and tens of miles long. Thus, they impact a very small area compared to ARs, which typically extend hundreds of miles in width and over a thousand miles in length. The maximum 15-min rainfall intensity associated with the NCFR was 70 mm/h (2.75 in/h). This very high intensity rainfall likely caused increased pore water pressure at the soil-bedrock interface, leading to landslide initiation. With measured rainfall intensities also greater than the saturated hydraulic conductivity of the soil surface, overland-flow-inducing erosion may have also led to debris flow generation.

Meteorological forcing can cause extreme landscape change through delivery of intense and/or long‐duration rainfall. However, linkages between the particular meteorological features that lead to rainfall enhancement and the resultant landscape change have generally received little attention from the geomorphologic and landslide hazard communities. This work is intended to inspire more collaboration between the geomorphology and meteorology communities, as well as promote improved understanding of the meteorological phenomena that result in landscape evolution and hazard initiation.

Figure 2. Regional mesoscale map of the 22 March 2018 NCFR in the vicinity of Groveland, California at 20:10 UTC (1:10 pm local time – PDT). Cores (C) and gaps (G) are visible in the NCFR and the structure aligns with the impacted study area featuring the concentrated landslide distribution (Fig. 1). Radar data is shown in dBZ. Pink triangles indicate locations of rain gauges. Purple triangle is location of New Exchequer Dam (NER) used for supplemental meteorological observations. DP = Don Pedro Reservoir, HH = Hetch Hetchy Reservoir. Radar data from NOAA (https://www.cnrfc.noaa.gov/radarArchive.php; accessed on 18 March 2020).

This work addresses the priority area of Atmospheric Rivers Research and Applications in the CW3E 2019-2024 strategic plan. This case is a compound event involving an atmospheric river followed by an NCFR and lends insight to how atmospheric rivers can “set the stage” for subsequent impacts, even if they are not impactful themselves. In this case, the AR elevated soil moisture such that subsequent high-intensity rainfall resulted in landslides and flash flooding. This publication also demonstrates CW3E’s core value of collaboration, by working across the disciplines of geomorphology and meteorology, as well as the core value of practical applications, by applying atmospheric science to geologic hazards.

Read the full publication here: https://agupubs.onlinelibrary.wiley.com/doi/full/10.1029/2020JF005675

Collins, B. D., Oakley, N. S., Perkins, J. P., East, A. E., Corbett, S. C., & Hatchett, B. J. (2020). Linking Mesoscale Meteorology With Extreme Landscape Response: Effects of NCFR. Journal of Geophysical Research: Earth Surface, 125, e2020JF005675. https://doi.org/10.1029/2020JF005675 .

CW3E and Universidad de Chile Virtually Host the International Atmospheric Rivers Conference-Sponsored Symposium

CW3E and Universidad de Chile Virtually Host the International Atmospheric Rivers Conference-Sponsored Symposium

October 12, 2020

IARC-2020 was a 5-day, fast-paced, and lively virtual conference, held October 5th – 9th. Originally scheduled to take place at Universidad de Chile, Santiago, the conference moved to a virtual platform this year due to the pandemic, with 50 oral presentations, 71 two-minute “lightning” presentations, and approximately 500 registered participants! This represents a continued growth in presentations and attendance from the first two IARC meetings in 2016 and 2018 (75 and 100 total presentations and 100 and 125 participants, respectively). The topics covered this year were: dynamical & physical processes in ARs; impacts of ARs; AR modeling and forecasting; ID, tracking, and inventories; and ARs in the past and future.

The idea of IARC was born from an AR Workshop hosted by CW3E in 2015. Dr. F. Martin Ralph organized a steering committee of international experts, which then convened the first IARC. The main goal of the conference was to bring together a diverse and global community of experts across the fields of atmospheric, hydrologic, oceanic, and polar sciences, as well as water management, civil engineering, and ecology, to advance the state of atmospheric river science and to explore new directions, improved means of disseminating AR forecast information, and upgrades to existing monitoring techniques. The conference was designed to maximize interaction time and encourage collaboration and included breakout sessions and panel discussions along with traditional oral and poster sessions. The conference also strongly encouraged student participation. For a detailed description of the history of IARC, meeting summary articles, and more, please see the website: /iarc/

The entire IARC Steering Committee would like to thank everyone who has contributed and participated in the symposium for helping make it a success! We hope to see, in person, all the familiar faces, as well as many new ones, for the next IARC.

Please see the IARC website for program information, presentation abstracts, and video recordings of the plenary sessions.

IARC Day 5 Panel members answering questions from the audience. (Friday, October 9, 2020)

CW3E Attends BSMAR and SWEPSYM Virtual Events

CW3E Attends BSMAR and SWEPSYM Virtual Events

October 10, 2020

On 6-8 October, CW3E participated in the 17th Biennial Symposium on Managed Aquifer Recharge (BSMAR-17) and Southwest Extreme Precipitation Symposium (SWEPSYM) crossover event. This year, BSMAR 17 teamed with the Floodplain Management Association and CW3E to hold the SWEPSYM. Unlike in previous years, these two events came together as a virtual event consisting of two presentation “tracks”, BSMAR topics and SWEPSYM topics, over the course of three days.

BSMAR is a collaborative effort between the Arizona Hydrological Society (AHS) and the Groundwater Resources Association (GRA) of California. The symposium continues a longstanding series of symposia originating in Arizona in 1978. The BSMAR 16 conference was held in March 2018 in San Diego. BSMAR 15 was combined with the Ninth International Symposium on Managed Aquifer Recharge (ISMAR 9) held in Mexico City in 2016.

SWEPSYM is an annual conference co-hosted by the Floodplain Management Association and CW3E that brings together the scientific community and water managers in the Southwest. The conference is at the interface of research and applications. In particular it has 4 main objectives:

  • Bring attention to precipitation extremes in the Southwest region of North America
  • Share technical and scientific information and knowledge about the various factors responsible for producing extreme precipitation and the hydrologic processes responsible for generating runoff in semi-arid and arid areas
  • Advance our understanding of the causes of extreme precipitation with the hope of increasing the warning time of precipitation extremes, ranging from droughts to floods
  • Exchange information on engineering, water management, flood control, agricultural, and other Southwest regional needs for information on extreme precipitation

CW3E’s director, Marty Ralph, Ph.D., started off the crossover event Tuesday with a keynote address titled “Bridging the Gap between Atmospheric Science and MAR!”. CW3E scientists Anna Wilson and Peter Gibson gave presentations in the SWEPSYM track on Wednesday and CW3E student Mike Sierks and CW3E researcher Forest Cannon helped moderate the event.

The next SWEPSYM and BSMAR events are scheduled for 2022. You can view the BSMAR Technical Program for the full 2020 schedule, and you can visit the SWEPSYM website to download slides and view presentations from the 2020 symposium.


Screenshots from the SWEPSYM track on Wednesday, 7 October. Top: Anna Wilson presents “Enhancing Hydrometeorological Observing Systems Throughout California”. Bottom: Peter Gibson presents “Forecasting Ridging Related to Precipitation Deficits Across the Colorado River Basin.”

CW3E AR Update: 9 October 2020 Outlook

CW3E AR Update: 9 October 2020 Outlook

October 9, 2020

Click here for a pdf of this information.

Update on Atmospheric Rivers Forecast to Impact the Northwestern US

  • Multiple landfalling ARs are forecast to bring significant precipitation to the northwestern US during the next 7 days
  • Current forecasts suggest that AR 3/AR 4 conditions (based on the Ralph et al. 2019 AR Scale) are possible over coastal Oregon and Washington in association with the first and third ARs
  • Inland penetration of these ARs may also produce AR 2/AR 3 conditions over portions of interior Oregon and Washington
  • 7-day total precipitation is forecast to exceed 7 inches over the Olympic Mountains and North Cascades, with more than 3 inches of precipitation possible over the Northern Rockies

Click images to see loops of GFS IVT/IWV analyses and forecasts

Valid 1200 UTC 9 October – 1200 UTC 17 October 2020


Summary provided by C. Castellano, J. Kalansky, B. Kawzenuk, and F. M. Ralph; 9 October 2020

*Outlook products are considered experimental