
CW3E Publication Notice
West-WRF 34-year reforecast: Description and Validation
September 19, 2023
A new paper titled “West-WRF 34-year reforecast: Description and Validation” by Alison Cobb, Daniel Steinhoff (CW3E), Rachel Weihs (CW3E), Luca Delle Monache (Deputy Director, CW3E), Laurel DeHaan (CW3E), David Reynolds (U Colorado), Forest Cannon (Tomorrow.IO), Brian Kawzenuk (CW3E), Caroline Papadopolous (CW3E), and Marty Ralph (Director, CW3E) was recently accepted to the Journal of Hydrometeorology. This paper describes the development and evaluation of a novel high-resolution long-term regional forecast product, based on CW3E’s near-real time forecast model, West-WRF. The West-WRF 34-year reforecast was generated by dynamically downscaling the control member of the GEFSv10 reforecast over the Western U.S. and northeastern Pacific Ocean during the cool season months (1 December through 31 March) between 1986-2019. The forecasts are available at a 9-km resolution over much of the Eastern Pacific and Western North America out to 7 days and at a 3-km resolution primarily over California. This valuable dataset is being used to further study extreme precipitation and atmospheric river activity through physical process studies, training for post-processing and machine learning techniques, and climatological analysis. It supports CW3E’s 2019-2024 Strategic Plan by providing an evaluation of West-WRF with the goal to identify benefits and added value of the forecasting system as well as and areas to further target model development.
This paper shows the added value of the dynamical downscaling of GEFS into the West-WRF reforecast on scales important for both basin/reservoir water management and for climatological understanding of extreme events across the West. Verification of near-surface temperature, wind, and humidity highlight the added value in the reforecast compared to GEFSv10. The West-WRF reforecast also shows clear improvement in atmospheric river characteristics (intensity and landfall) over GEFS. Figure 1 shows the intensity error, landfall position error, and distance from perfect MoE averaged across all categorized ARs for both the West-WRF 9-km reforecast and GEFS, as well as the differences between the two. For all three metrics, the reforecast has smaller errors across all forecast lead times than GEFS. The improvements are statistically significant at the 95% confidence level for three lead times for landfall position error, four lead times for AR intensity error, and all seven lead times for MoE (when the error bars for the difference are below 0). The largest improvement in intensity error occurs at the 48-hour forecast, improving the intensity forecast by almost 4 kg m-1 s-1, which is an average error reduction of over 5%, while the largest improvement in landfall position error occurs at the 144-hour forecast, with an improvement of over 30 km. The reduction in MoE error with the reforecast corresponds to an average improvement in location of the whole AR of 1% of the area of the AR. This 1% can range from an area of 20,000 km2 for a small AR to over 500,000 km2 for a large AR that is correctly forecasted as an AR. These results demonstrate a consistent, clear improvement in AR intensity, landfall, and location characteristics using the West-WRF reforecast compared to GEFS.
Analysis of mean areal precipitation (MAP) shows that at the basin-scale, the reforecast can improve MAP compared to GEFSv10 and reveals a consistent low bias in the reforecast for a coastal watershed (Russian) and a high bias observed in a Northern Sierra watershed (Yuba). The reforecast has a dry bias in seasonal precipitation in the northern Central Valley and Coastal Mountain ranges, and a wet bias in the Northern Sierra Nevada, which is consistent with other operational high resolution (< 25 km) regional models.
Overall, the paper serves to introduce this reforecast dataset to the scientific community as a resource for quality, high resolution atmospheric forecasts of extreme precipitation events largely from ARs. It can be used to further quantify ARs, their characteristics, uncertainties and impacts, and the representation of those characteristics and impacts in the West-WRF reforecast beyond that presented in the paper. The positive verification results of the reforecast show that it can be leveraged for scientific studies of ARs and extreme precipitation, machine learning, and further model evaluation.
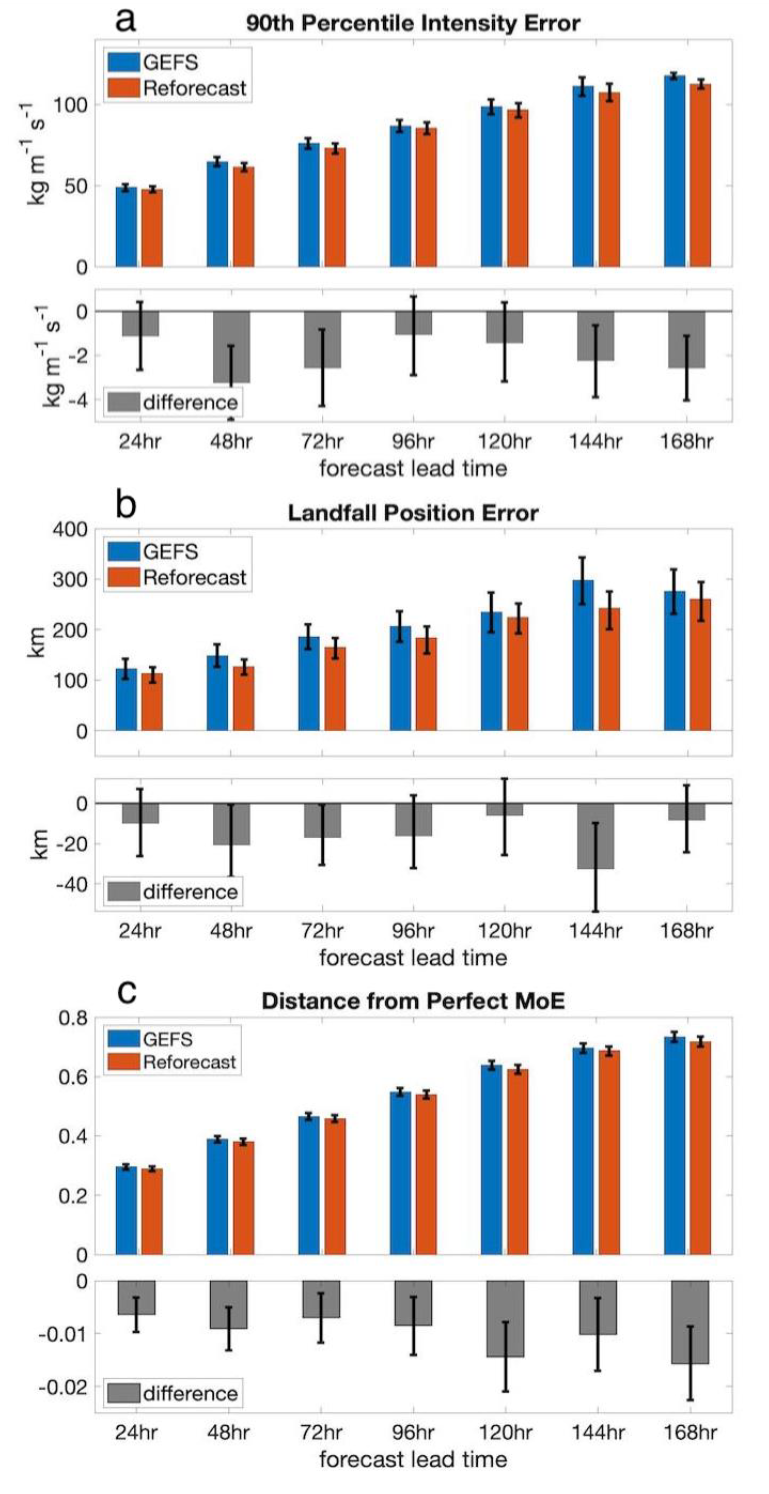
Figure 1: Figure 7 from Cobb et al. (2023) a) AR intensity error using a threshold of 500 kg m-1 s-1, where intensity is defined as the 90th percentile value within any AR object. Upper panel shows full values, and the lower panel shows the difference (Reforecast minus GEFS). b) AR landfall position error using a threshold of 500 kg m-1 s-1, where landfall position is defined as the latitude of maximum IVT at the coastline. c) distance from perfect MoE for a threshold of 500 kg m-1 s-1. In all cases, the error bars are the 95 % confidence interval computed with bootstrapping.
Cobb, A., Steinhoff, D., Weihs, R., Delle Monache, L., DeHaan, L., Reynolds, D., Cannon, F., Kawzenuk, B., Papadopolous, C., & Ralph, F.M. (2023). West-WRF 34-Year Reforecast: Description and Validation. Journal of Hydrometeorology (published online ahead of print 2023). https://doi.org/10.1175/JHM-D-22-0235.1


