CW3E Event Summary: 29 November – 5 December 2022

CW3E Event Summary: 29 November – 5 December 2022

December 6, 2022

Click here for a pdf of this information.

Active Weather Pattern Brings Heavy Rain and Snow to Western US

  • A low-pressure system associated with an upper-level shortwave trough and a weak atmospheric river (AR) impacted the western US during 30 Nov – 2 Dec
  • A second low-pressure system and shortwave trough/cutoff low primarily impacted California on 2–5 Dec
  • A moderate-strength atmospheric river (AR) developed over California on 3 Dec as the second shortwave trough became cut off from the main midlatitude flow and interacted with a region of subtropical moisture
  • AR 2 conditions (based on the Ralph et al. 2019 AR Scale) were observed over the Central California coast
  • A separate AR associated with a tropical moisture export (TME) brought AR 2 conditions to southern Arizona on 3–4 Dec
  • The first storm produced 2–4 feet of snow in the Washington Cascades and Rocky Mountains in Idaho, Montana, and Wyoming, as well as 1–2 feet of snow in the Sierra Nevada
  • The second storm and AR produced more than 5 inches of rain over the Big Sur coast and 1–3 feet of snow in the higher terrain of the Sierra Nevada
  • Heavy rain on 3 Dec caused a rockslide on Highway 1 south of Big Sur, CA
  • The third AR produced 2–4 inches of rain across portions of Arizona, resulting in flooding in Pinal County


Summary provided by C. Castellano, S. Bartlett, C. Hecht, J. Kalansky, S. Roj, and F.M. Ralph; 6 December 2022

To sign up for email alerts when CW3E post new AR updates click here.

*Summary products are considered experimental

CW3E Welcomes Dr. Jonathan Rutz

CW3E Welcomes Dr. Jonathan Rutz

December 6, 2022

Dr. Jonathan Rutz joined the Center for Western Weather and Water Extremes (CW3E) at the UCSD Scripps Institution of Oceanography in December 2022 as an Atmospheric Scientist. His responsibilities will include making advancements in atmospheric river (AR) science and precipitation forecasting skill, leadership of CW3E and National Weather Service (NWS) collaborative efforts, co-leadership of the Advanced Quantitative Precipitation Information (AQPI) project, contributions to the AR Reconnaissance field campaign, and more.

Dr. Rutz earned his B.S.Eng with dual concentrations in Meteorology and Climate Physics from the University of Michigan in 2009. He later earned both his M.S. (2011) and Ph.D. (2014) in Atmospheric Science from the University of Utah. He worked as an intern in the Science and Technology Integration Division of the NWS from 2010 to 2014 while completing his graduate degrees, and was converted to a full-time position as Meteorological Program Leader in 2014.

Dr. Rutz has led extensive research on the climatology and impacts of inland-penetrating atmospheric rivers over the Western United States. He has also served as initial co-chair of the atmospheric river tracking method intercomparison project (ARTMIP), which seeks to better quantify the climatology of ARs and AR-related precipitation, as well as how these will be affected by climate change. He is also a co-editor and co-author of the book, Atmospheric Rivers (Springer, 2020). Dr. Rutz has collaborated extensively with CW3E on numerous projects such as creation of the AR Scale and a number of research-to-operations efforts resulting in forecast products used widely by NWS staff. He has also spent years training NWS users on the usage, interpretation, and application of these and other cutting-edge forecast products.

Dr. Rutz is very excited to be joining CW3E where he says, “the record of scientific excellence, real-world applicability, and professional camaraderie are unmatched”.

CW3E AR Update: 5 December 2022 Outlook

CW3E AR Update: 5 December 2022 Outlook

December 5, 2022

Click here for a pdf of this information.

Potential for Multiple Atmospheric Rivers to Impact the US West Coast During the Next 7 Days

  • Two atmospheric rivers (ARs) are forecast to make landfall along the US West Coast on 9 Dec and 12 Dec
  • The first AR is forecast to bring a short period of AR 1 conditions (based on the Ralph et al. 2019 AR Scale) to coastal Southern Oregon
  • The deterministic GFS and ECMWF have drastically different solutions for a developing area of low-pressure associated with the second AR, making it difficult to pinpoint the timing, IVT intensity, and landfall location
  • The 00Z deterministic GFS is forecasting the second AR to make landfall in coastal Northern California and bring AR conditions to most of California, while the 00Z deterministic ECMWF is forecasting the second AR to make landfall in coastal Washington about 20 hours later with limited AR conditions into coastal Northern California
  • There is a large amount of uncertainty in forecast AR activity associated with both ARs in GEFS and ECMWF EPS
  • In comparison to the 00Z ECMWF, the 00Z GFS is forecasting greater 7-day watershed precipitation total throughout the mountainous regions of California, Oregon, and Washington

Click images to see loops of GFS IVT and IWV forecasts

Valid 0000 UTC 05 December – 1200 UTC 12 December 2022


Summary provided by S. Roj, S. Bartlett, C. Castellano, J. Kalansky, and F. M. Ralph; 05 December 2022

To sign up for email alerts when CW3E post new AR updates click here.

*Outlook products are considered experimental

CW3E presents AR research and applications with San Bernardino Special Districts

CW3E presents AR research and applications with San Bernardino Special Districts

December 2, 2022

CW3E Atmospheric Scientist Rachel Weihs spoke with 50 members of the Association of San Bernardino County Special Districts (ASBCSD) during their monthly meeting at the Yucaipa Water District in Yucaipa, CA. The members learned about the Center’s mission, the basics of atmospheric rivers (ARs), and key research applications conducted at the Center. This included information on the AR scale, sampling observations within ARs with aircraft (AR Recon), and Forecast-Informed Reservoir Operations (FIRO).

The visit helped to emphasize the Center’s role in providing research and tools targeted towards mechanisms that drive the regions’ annual precipitation patterns and provide engagement with key folks involved in water management in Southern California.

CW3E Welcomes Adolfo Lopez Miranda

CW3E Welcomes Adolfo Lopez Miranda

December 1, 2022

Adolfo Lopez Miranda joined CW3E as a lab tech and field assistant in December 2022. This past June he graduated from UC San Diego with a BS degree in Mechanical Engineering. Adolfo has been involved with CW3E since the summer of 2021, when he was an intern on the field team. His project that summer was to develop a telemetry system for stations in a hydroclimate network in California’s Sierra Nevada. He developed open-source code that will be executed by a microcontroller that will automatically record the data via a serial port of an environmental data logger, and upload hourly text files to a web server. The data files are retrievable and can then be stored on databases located at the Scripps.

His experience as an intern enhanced his perspective on environmental processes and sustainability, and how such factors impact communities in society. As a first-generation Mexican-American that grew up in an inner city, these newfound views allowed him to share his experiences in similar communities and become an advocate for research on environmental topics and improving sustainability. All in all, Adolfo is ecstatic to be a part of the field team and begin his career at CW3E.

CW3E Publication Notice: Representation of Atmospheric Water Budget and Uncertainty Quantification of Future Changes in CMIP6 for the Seven U.S. National Climate Assessment Regions

CW3E Publication Notice

Representation of Atmospheric Water Budget and Uncertainty Quantification of Future Changes in CMIP6 for the Seven U.S. National Climate Assessment Regions

November 30, 2022

CW3E researcher Agniv Sengupta, along with co-authors Duane E. Waliser, Bin Guan, Colin Raymond, and Huikyo Lee (NASA Jet Propulsion Laboratory), and Elias C. Massoud (Oak Ridge National Laboratory) recently published a paper titled “Representation of Atmospheric Water Budget and Uncertainty Quantification of Future Changes in CMIP6 for the Seven U.S. National Climate Assessment Regions” in the Journal of Climate. The work contributes to the goals of CW3E’s 2019-2024 Strategic Plan to support Monitoring and Projections of Climate Variability and Change. In support of the upcoming Fifth U.S. National Climate Assessment (NCA5) report, the study provides a comprehensive diagnosis of the atmospheric water budget with quantitative model comparison and multimodel ensemble projections and seeks to relay these projections from state-of-the-art coupled climate models to stakeholders with adequate uncertainty estimates.

The continental U.S. lies between the high-latitude regions, which are projected to become wetter, and the subtropical zone, which is projected to become drier. As such, there exists considerable uncertainty in the future projected changes in precipitation, in particular for the midlatitude regions. The work is motivated by the opportunity to track model progress across the CMIP phases of experiments in representing the various components of the water cycle and the lack of comprehensive NCA-focused analyses using a moisture-budget framework. A distinctive feature of this work is a focus on the examination of the atmospheric water budget, in particular, the relative importance of remote and local contributions–the convergence of moisture fluxes and local land surface processes (evapotranspiration) respectively–in generating precipitation.

The analysis revealed that, in winter, the remote contributions via moisture flux convergence play a much more important role than local evapotranspiration in all seven NCA regions (Fig. 1, upper panel). In fact, it accounts for four-fifths of the precipitation received in the Northwest, and three-fifths in the Southwest. The CMIP6 multi-model mean (MMM), however, overestimates the remote influence from the Pacific for both of these regions, resulting in a wet bias in the winter mean precipitation. In summer, the local recycling of precipitation via evapotranspiration is found to be larger than the convergence of moisture fluxes from remote regions (Fig. 1, lower panel). The CMIP6 MMM underestimates the local contribution of evapotranspiration in the Southern Great Plains, resulting in an expansive summer precipitation deficit.

Figure 1: Seasonal mean atmospheric water budget (mm day-1) from observations and CMIP6 multi-model mean (MMM) during two seasons: (top) winter (DJF) and (bottom) summer (JJA) in each of the seven NCA regions: Northwest (NW), Southwest (SW), Northern Great Plains (NGP), Southern Great Plains (SGP), Midwest (MW), Northeast (NE), and Southeast (SE). Here, P is precipitation, ET is evapotranspiration, MFC is the vertically integrated moisture flux convergence, and RES = (P – ET – MFC) is the residual. The period of analysis is 1981–2010.

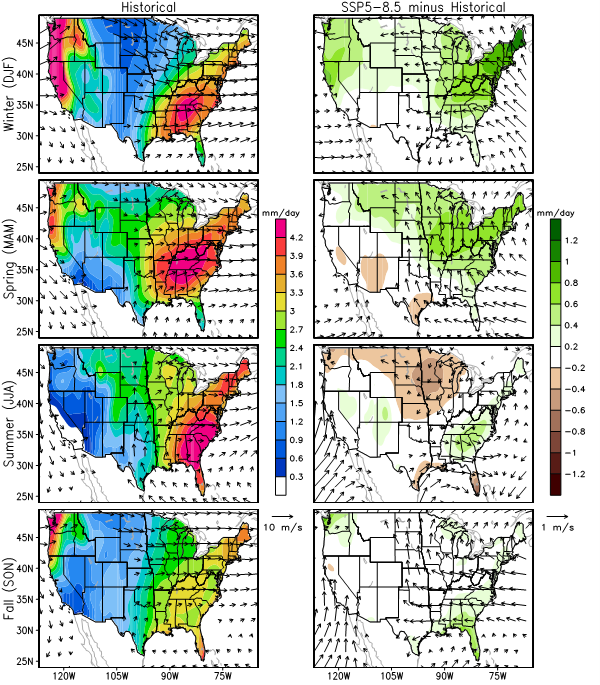
Furthermore, this study provided an NCA-specific view into end-of-century precipitation changes over the CONUS (Fig. 2) with winter mean precipitation projected to increase over five of the seven regions, consistent with an increase in cyclonic circulation over the East Coast and an enhancement of moisture transport from the Atlantic. In summer, the future projections exhibit a meridional dipolar distribution with a widespread decline in the Northern Great Plains and the Midwest and an increase in the Southeast. These changes are also supported by the circulation setup: enhanced anticyclonic flow in the Southeast transporting surplus moisture from the Gulf of Mexico and weakening of southerly flow into the northern and midwestern states with enhanced moisture flux divergence.

In support of ongoing NCA efforts, the Sengupta et al. (2022) study provides an important benchmark for assessing changes to the water cycle in a warming world. The findings of the study help foster the ability to discern which projections are most reliable and therefore usable in complex decision-making contexts, as well as identifying the aspects that need further observational and model development work.

Figure 2: Projected change in seasonal mean precipitation (shading; mm day-1) and 850-hPa winds (vectors; m s-1) from CMIP6 for the end-of-the-century (2071–2100) under the SSP5–8.5 scenario. (left) The climatological mean in the CMIP6 MMM over the historical period (1981–2010) and (right) future change (2071–2100 relative to the 1981–2010 average). Results are shown for winter (DJF), spring (MAM), summer (JJA), and fall or autumn (SON).

Sengupta, A., Waliser, D. E., Massoud, E. C., Guan, B., Raymond, C., & Lee, H. (2022). Representation of Atmospheric Water Budget and Uncertainty Quantification of Future Changes in CMIP6 for the Seven U.S. National Climate Assessment Regions, Journal of Climate, 35, 3635-3658, https://doi.org/10.1175/JCLI-D-22-0114.1.

CW3E AR Update: 29 November 2022 Outlook

CW3E AR Update: 29 November 2022 Outlook

November 29, 2022

Click here for a pdf of this information.

Atmospheric River to bring precipitation to the U.S. West Coast

  • A strong low-pressure system associated with an upper-level shortwave trough will impact much of the US West Coast today through Thursday, with the development of an atmospheric river over Northern California
  • After the initial AR, a second low-pressure system will develop offshore and travel down the coast, bringing another round of precipitation to the region Friday into Sunday
  • There is considerable model disagreement between the GFS and ECMWF, with the ECMWF forecasting more intense AR2 conditions along the coast of California during AR landfall
  • The National Weather Service Weather Prediction Center is forecasting up to 7 inches of precipitation for mountainous regions along the border of Oregon and California during this event, with a marginal risk for excessive rainfall along the coast
  • Rivers are expected to rise in Southern Oregon and Northern California during this storm, but are not forecast to exceed flood stage as a result of this event
  • Cold air associated with the upper-level trough moving into the area will lead to lower freezing levels in the region
  • National Weather Service forecast offices across the western U.S. have begun issuing public guidance for this storm, including winter storm watches and warnings in advance of snowfall totals in exceeding 24 inches for some locations at higher elevations

Click images to see loops of GFS IVT and IWV forecasts

Valid 1200 UTC 29 November – 0000 UTC 5 December 2022


Summary provided by S. Bartlett, C. Castellano, S. Roj, M. Steen, J. Kalansky, and F. M. Ralph; 29 November 2022

To sign up for email alerts when CW3E post new AR updates click here.

*Outlook products are considered experimental

CW3E Welcomes Rosy Luna Niño

CW3E Welcomes Rosy Luna Niño

November 22, 2022

Rosy is a postdoctoral scholar whose research includes regional modeling, weather events, interannual variability, climate change, as well as their regional and local impacts. Her work has explored the dynamic of the winter phenomena: subtropical jet stream, cold fronts, winds in the Gulf of Mexico (Nortes), and their future climate projections for the 21st century. During her Ph.D. and previous collaborations, Rosy has also studied the dynamical models WRF and RegCM, to better understand and simulate regional and local processes like winter precipitation and intense winds in Mexico (Nortes, Tehuanos). Her initial work at CW3E/Scripps focuses on the statistical seasonal climate and hydrology – precipitation, temperature, streamflow – prediction for the Western US related as well as investigating the role of Atmospheric Rivers in our varying and changing hydroclimate.

CW3E Publication Notice: Seasonality of MJO Impacts on Precipitation Extremes Over the Western U.S.

CW3E Publication Notice

Seasonality of MJO Impacts on Precipitation Extremes Over the Western U.S.

November 21, 2022

A new paper entitled “Seasonality of MJO Impacts on Precipitation Extremes Over the Western U.S.” was recently published in the Journal of Hydrometeorology and authored by CW3E researcher Jiabao Wang, Mike DeFlorio (CW3E), Bin Guan (UCLA/JPL), and Chris Castellano (CW3E). As part of CW3E’s 2019-2024 Strategic Plan, CW3E seeks to improve understanding of the subseasonal-to-seasonal (S2S) predictability of extreme weather over the western U.S. and develop a comprehensive understanding of the physical mechanisms and statistical characteristics of extreme precipitation events to inform current and future resource and risk management. This study (Wang et al. 2022) discovered strong seasonality in boreal winter western U.S. extreme precipitation that is modulated by seasonality in the Madden-Julian oscillation (MJO) and its impacts on the large-scale circulation and atmospheric river (AR) activity over the North Pacific and western North America. This research was funded by the California Department of Water Resources Atmospheric River Program Phase III and the National Aeronautics and Space Administration.

This study provides observational evidence of MJO impacts on extreme precipitation intensity, frequency, and duration over the western U.S. in boreal winter. In general, the MJO impacts on extreme precipitation intensity and duration are more uncertain than its impacts on extreme precipitation frequency. A robust increase in extreme precipitation frequency relative to climatological conditions over most of the western U.S. is expected when the MJO is in the western Pacific (Phases 6-7), and opposite changes are observed when the MJO is located over the Indian Ocean and Maritime Continent. The above MJO influence, however, is characterized by strong seasonality, with an increase in extreme precipitation frequency mainly found in late autumn/early winter (October-December; OND) over California, and weaker or opposite response found in late winter (January-March; JFM) following an MJO in Phases 6-7. This seasonality largely originates from the different amplitudes and patterns of both the MJO and the North Pacific jet, which are weaker and located/retreated more northwestward in OND compared to JFM. This leads to different responses in MJO teleconnections including moisture transport and AR activity that contribute to the different changes in precipitation extremes (summarized in Fig. 1). As a result, the moisture transport in OND brings moisture from the Pacific Ocean towards the western U.S., leading to an increase in AR activity and extreme precipitation frequency over California. On the other hand, moisture transport in JFM is diverted more poleward towards Alaska, leading to a decrease in AR activity and extreme precipitation over the western U.S.

The findings in this study suggest a value for future studies to consider the seasonal dependence of the MJO-precipitation extreme relationship. The results also have implications for the source of S2S predictions, which has potential value to stakeholders including water resource managers.

Figure 1: The schematic diagram of extratropical response (precipitation extremes, 500-hPa geopotential height anomalies, anomalous moisture transport, and AR activity) to MJO phases 6-7 in (top) OND and (bottom) JFM. Results are derived from the 5-9-day lagged average after the active MJO day at day 0. The green triangle indicates the center longitude of enhanced MJO convection at day 0. The jet (mean 250-hPa zonal wind as the basic state) interval is 20 m s-1 starting at 30 m s-1. The relative magnitude of each component is indicated by the difference in the thickness and length, and the variables shown may not be entirely precise in location and pattern.

Wang, J., DeFlorio, M. J., Guan, B., & Castellano, C. M. (2022). Seasonality of MJO Impacts on Precipitation Extremes Over the Western U.S. Journal of Hydrometeorology (published online ahead of print 2022). https://doi.org/10.1175/JHM-D-22-0089.1