CW3E demonstrates balloon launch, discusses research with USC students at Wrigley Marine Science Center

CW3E demonstrates balloon launch, discusses research with USC students at Wrigley Marine Science Center

March 22, 2022

USC students release a weather balloon under the supervision of CW3E Field Researcher Benji Downing at USC’s Wrigley Marine Science Center on Catalina Island.

On Thursday March 17th, CW3E field team member Benji Downing led a discussion and balloon launch demonstration for University of Southern California (USC) students at the Wrigley Marine Science Center (WMSC). Part of the USC Wrigley Institute for Environmental Studies (WIES), WMSC is a Catalina Island facility where faculty and students from USC and other institutions conduct hands-on study on the environment and sustainability. CW3E has partnered with WMSC since 2020. A RADMet station is deployed there (vertically pointing radar, disdrometer, and surface meteorology), and we also launch radiosondes from this location. Data are collected continuously with the RADMet and during atmospheric river (AR) events, or to support Atmospheric River Reconnaissance missions, with radiosondes. These data collection efforts support forecasting, advance scientific understanding, and provide critical information for model verification during ARs. This data collection effort supports Forecast Informed Reservoir Operations at Prado Dam, with funding provided by the US Army Corps of Engineers and Orange County Water District.

USC students were on the island for a spring break trip to learn about Wrigley Institute programs and research conducted at the science center by WIES and its partners, including CW3E. 23 graduate and undergraduate students from departments across USC joined the CW3E field team to participate in a weather balloon launch and learn about research being conducted at CW3E. Marcella Riddick, who studies social entrepreneurship, and Stevie Gray, a film major, worked together to set up the tripod and fill the balloon with helium, while Aries Wong, an economics and mathematics major, helped ready the sonde. A biological science major, Sophia Lee, held the balloon for launch.

Students were delighted to see the balloon launch and eager to learn about atmospheric modeling, data collection, and interpretation, and about CW3E and WMSC research efforts. Among the topics discussed were sensor networks and tools used for data collection, the importance of accurately forecasting extreme precipitation events, and how CW3E research supports improvements in this research area.

The demonstration highlighted the importance of collaboration between CW3E and WMSC and helped to cultivate interest about science in students from many different backgrounds and areas of study. CW3E is grateful to partner with WMSC on this important work.

CW3E Welcomes Chris Delaney

CW3E Welcomes Chris Delaney

March 9, 2022

Chris Delaney joined CW3E on March 1, 2022, as a research engineer to support Forecast Informed Reservoir Operations projects. Chris comes from Sonoma Water where he spent 17 years providing leadership and ingenuity in the management of the water resources of the Russian River. Chris has been involved with FIRO from its beginnings with the first pilot project at Lake Mendocino where he developed a novel approach to FIRO, Ensemble Forecast Operations, which was selected as the preferred alternative in a 2020 final viability assessment. Chris earned a B.S. in Environmental Resources Engineering from the Humboldt State University (1997). Additionally, the many years of partnering with researchers, such as CW3E, to develop engineering solutions for the unique challenges of the Russian River system have provided Chris a wealth of experience in water resources and reservoir management.

At CW3E, Chris will continue the FIRO engineering research that he spearheaded for Lake Mendocino and evaluate other reservoirs systems throughout the West. Through the guidance of Luca Delle Monache, Chris will develop and analyze new reservoir operations that can skillfully utilize forecast information to inform reservoir release decisions.

CW3E Publication Notice: Future changes of PNA-like MJO teleconnections in CMIP6 models: underlying mechanisms and uncertainty

CW3E Publication Notice

Future changes of PNA-like MJO teleconnections in CMIP6 models: underlying mechanisms and uncertainty

March 8, 2022

CW3E postdoc Dr. Jiabao Wang, along with co-authors Dr. Hyemi Kim (Stony Brook University professor) and Dr. Mike DeFlorio (CW3E researcher), recently published a paper in the Journal of Climate titled “Future changes of PNA-like MJO teleconnections in CMIP6 models: underlying mechanisms and uncertainty” (Wang et al. 2022). Wang and DeFlorio were supported by the California Department of Water Resources Atmospheric River Program Phase III.

The Madden-Julian Oscillation (MJO) is a tropical planetary-scale convectively coupled system traveling eastward from the Indian Ocean to the dateline with a period of approximately 30 to 60 days. It has significant global impacts on weather and climate systems including ridging events, atmospheric rivers, precipitation, and temperature through the generation of anomalous teleconnection patterns. In addition, the MJO is a key climate mode of variability in modulating subseasonal-to-seasonal (S2S) prediction skill of atmospheric rivers and ridging events over California.

This study examined the future changes in boreal winter MJO teleconnections (represented by anomalous 500-hPa geopotential height) over the Pacific/North America (PNA) region in 15 Coupled Model Intercomparison Project phase 6 models (CMIP6s) and found a robust and significant eastward extension (~4° eastward for the multi-model mean) of MJO teleconnections in the North Pacific. Other projected changes include more consistent teleconnection patterns between different MJO events, albeit with larger uncertainty. The authors then examined the mechanisms of the eastward teleconnection extension by comparing impacts of the future MJO and basic state changes on the anomalous Rossby wave source (RWS) that is important for teleconnection generation and stationary wavenumber and teleconnection wave paths that determine the teleconnection propagation using a linear baroclinic model (summarized in Figure. 1). The eastward extended jet in the future is found to play a more important role than the eastward-extended MJO in causing the eastward extension in MJO teleconnections. It leads to more eastward teleconnection propagation along the jet due to the eastward extension of turning latitudes before they propagate into North America.

The findings in this study have implications for the S2S predictability of MJO-related weather phenomena in the future climate. For example, they showed that MJO teleconnections may be more consistent between different MJO events in the future, leading to possibly more reliable S2S predictions for weather phenomena such as precipitation extremes and atmospheric rivers as they are highly modulated by MJO. The more eastward extension in MJO teleconnections, on the other hand, could lead to greater MJO impacts on the northeastern Pacific and North America.

Figure 1: The schematic diagram of dynamical processes (RWS and Rossby wave propagation) related to MJO teleconnections during MJO phase 3 in the (a) current and (b) future climate. Results are derived from the multi-model mean of CMIP6 historical and future runs. The vertical gray line indicates the “dateline”. The relative magnitude of each component is indicated by the difference in the thickness, length, or size of the graph. Note that the variables (e.g., anomalous RWS and propagation wave path) may not be entirely precise in location and pattern.

Wang, J., H. M. Kim, and M. J. DeFlorio (2022), Future changes of PNA-like MJO teleconnections in CMIP6 models: underlying mechanisms and uncertainty, J. Climate, https://doi.org/10.1175/JCLI-D-21-0445.1

CW3E Publication Notice: Atmospheric river precipitation enhanced by climate change: A case study of the storm that contributed to California’s Oroville Dam crisis

CW3E Publication Notice

Atmospheric river precipitation enhanced by climate change: A case study of the storm that contributed to California’s Oroville Dam crisis

March 8, 2022

Allison Michaelis, an Assistant Professor at Northern Illinois University, along with co-authors Sasha Gershunov (SIO/CW3E), Alexander Weyant (SIO), Meredith Fish (SIO alumna), Tamara Shulgina (CW3E), and F. Martin Ralph (CW3E), recently published a paper titled “Atmospheric river precipitation enhanced by climate change: A case study of the storm that contributed to California’s Oroville Dam crisis” in Earth’s Future. This study supports CW3E’s 2019-2024 Strategic Plan involving Atmospheric Rivers (AR) Research and Applications by quantifying the effects of climate change on a recent impactful AR event.

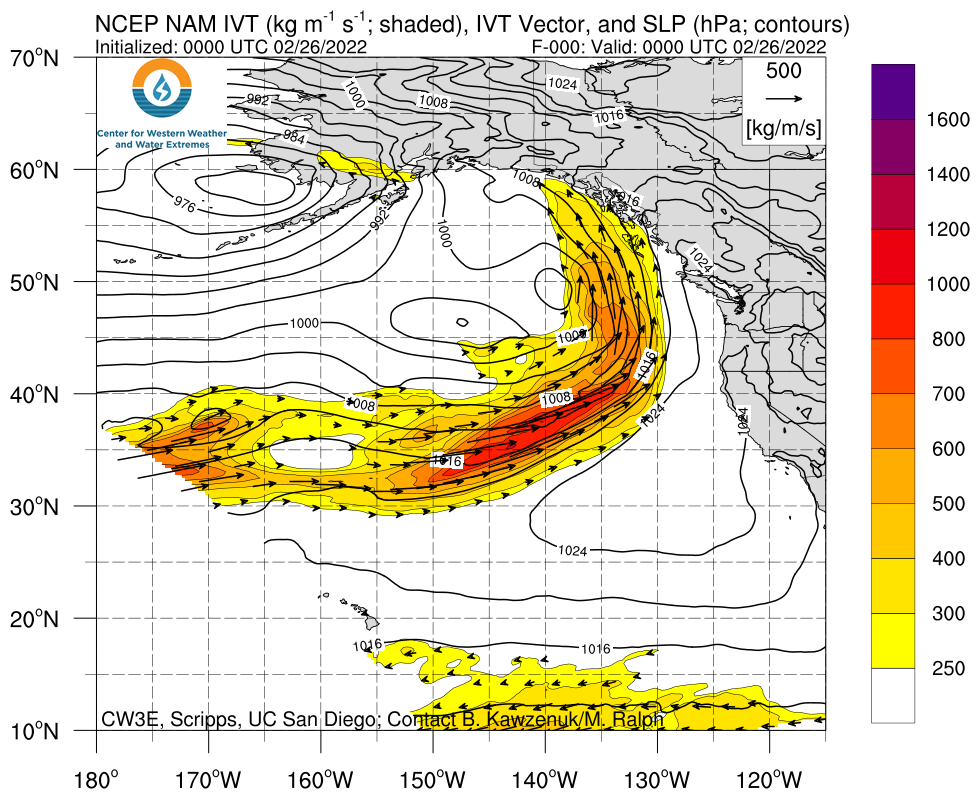
Michaelis et al. (2022) took a novel modeling approach to simulate the AR that contributed to the Oroville Dam crisis in early February 2017 (the Oroville AR) under global climate conditions representing pre-industrial, present-day, mid-, and late-21st century environments using the Model for Prediction Across Scales-Atmosphere (MPAS-A). The Oroville AR occurred between 6–11 February 2017 as two successive midlatitude cyclones in the eastern North Pacific basin moved onshore, creating multiple pulses of elevated IVT, and leading to sustained AR conditions over the Feather River Basin in Northern California for several days. The two AR pulses were quite distinct, both in terms of IVT orientation and temperature. The first pulse on 7 February was westerly and cool, producing significant snow on top of an already impressive snowpack, while the second pulse on 9 February had a more southerly orientation, was warmer with a higher snowline, and produced comparable amounts of total precipitation with more rain and less snow. Previous work estimated that melting due to rain-on-snow produced extreme runoff with snowmelt contributing between 25–50% of the total runoff and reservoir inflow from the AR.

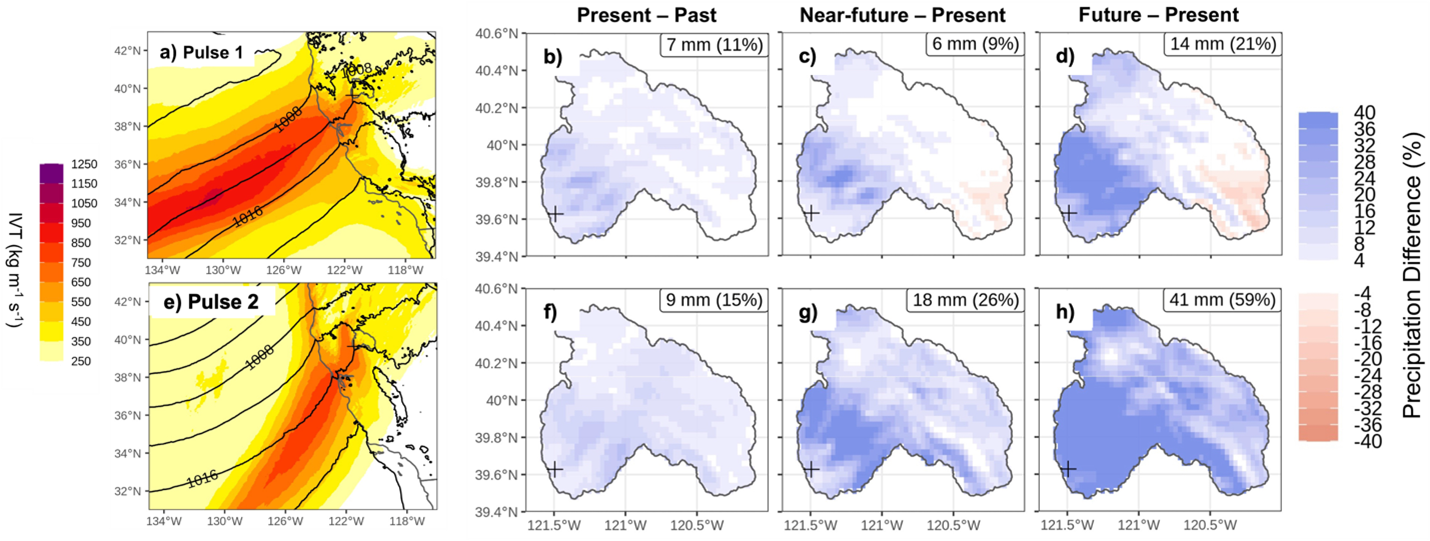
We estimate that climate change-to-date resulted in a ~11% and ~15% increase in precipitation over the Feather River Basin for the first and second pulses, respectively. Regarding future climate change, the first pulse of the Oroville AR showed precipitation increases of 9% and 21% through the mid- and late-21st century, respectively. Precipitation enhancements for the second pulse were almost tripled comparatively with a 26% increase through the mid-21st century and a 59% increase through the late-21st century. Although both pulses were enhanced by the imposed climate changes, the thermodynamic response and subsequent precipitation increases were most substantial during the second pulse. Such AR family dynamics provide a partial answer to why—although climate change, as we show here, has already contributed notably to precipitation from the Oroville AR—we have not yet clearly observed a trend in AR-related precipitation over our 70+ years of record. With continued global warming, however, we expect to soon see the anthropogenic trend emerge from natural variability in AR-related precipitation in California and other AR-targeted regions. The non-stationary nature of our climate system, particularly that due to human activity, manifesting on timescales of several human generations, requires a continual recalculation and readjustment of risks due to the changing nature of specific weather extremes as the climate crisis and global society’s responses to it evolve.

Figure 1: MPAS-A present-day ensemble mean IVT (kg m-1 s-1; shading) and sea-level pressure (SLP; hPa; black contours) for (a) 15 UTC 7 February 2017 and (e) 18 UTC 9 February 2017 during the first and second AR pulses, respectively. Difference in accumulated precipitation (% change) during the (b)–(d) first AR pulse from 06 UTC 7 February – 06 UTC 8 February and (f)–(h) second AR pulse from 03 UTC 9 February – 06 UTC 10 February for MPAS-A ensemble mean (b),(f) present minus past, (c),(g) near-future minus present, and (d),(h) future minus present. Absolute (mm) and percent changes (%) are reported in the top right corners of (b)–(d) and (f)–(h). The Oroville Dam location is indicated by a “+” in all panels. Adapted from Figures 2 and 4 in Michaelis et al. (2022).

Michaelis, A. C., Gershunov, A., Weyant, A., Fish, M. A., Shulgina, T., & Ralph, F. M. (2022). Atmospheric river precipitation enhanced by climate change: A case study of the storm that contributed to California’s Oroville Dam crisis. Earth’s Future, 10, e2021EF002537. doi: https://doi.org/10.1029/2021EF002537

CW3E Event Summary: 26 February – 2 March 2022

CW3E Event Summary: 26 February – 2 March 2022

March 3, 2022

Click here for a pdf of this information.

Atmospheric Rivers Produce Heavy Rainfall and Flooding in the Pacific Northwest

  • Multiple atmospheric rivers (ARs) impacted the Pacific Northwest between 26 Feb and 2 Mar
  • An AR 4 (based on the Ralph et al. 2019 AR Scale) was observed in coastal Oregon, where AR conditions persisted for more than 72 consecutive hours and maximum IVT values exceeded 750 kg m−1 s−1
  • AR conditions persisted for at least 48 hours over the Bay Area and the foothills of the Northern Sierra Nevada, resulting in an AR 2/AR 3 (based on the Ralph et al. 2019 AR Scale)
  • Inland penetration of the second AR led to AR 2 conditions in south-central Washington and north-central Oregon
  • More than 10 inches of total precipitation fell in parts of the Olympic Peninsula, Northern Oregon Coast Ranges, and Washington Cascades
  • The second AR produced several feet of snow in the higher elevations of the Washington Cascades and the Rocky Mountains in northern Idaho and Montana
  • Heavy rain associated with the second AR caused flooding throughout western Washington
  • Rain-on-snow exacerbated flooding and created an elevated risk of avalanches along the western slopes of the Cascades

Click images to see loops of NAM IVT/IWV analyses

Valid 0000 UTC 26 February – 0000 UTC 3 March 2022


Summary provided by Chris Castellano, J. Kalansky, B. Kawzenuk, Shawn Roj, F.M. Ralph; 3 March 2022

To sign up for email alerts when CW3E post new AR updates click here.

*Outlook products are considered experimental

CW3E Hosts AR and Forecast Tool Informational Session with USACE Portland District

CW3E Hosts AR and Forecast Tool Informational Session with USACE Portland District

March 1, 2022

Lookout Point Dam located on the Middle Fork Willamette River forms Lookout Point Lake, which has the largest water storage capacity within the Willamette River Basin. Photo courtesy USGS.

Brian Kawzenuk, CW3E meteorologist and applications programmer, and Julie Kalansky, CW3E Operations Manager, recently met with members of the U.S. Army Corps of Engineers Portland District to discuss atmospheric rivers, novel hydrometeorologic observations associated with atmospheric rivers and extremes, and CW3E forecast tools as it relates to FIRO. Members from the USACE Portland District included engineers, reservoir and project managers, and others working in flood risk management focused on the Willamette Valley in Northwest Oregon. The Willamette River is a main tributary to the Columbia River and has multiple dams throughout the system for the purposes of hydropower, flood risk management, and water storage.

During the meeting CW3E provided a brief overview of ARs and their impacts on the Western U.S., as well as insight into how ARs are observed, including CW3E’s observational network, and how they are forecasted. A review of CW3E forecast tools was provided with insight into the forecast of an AR that made landfall over the Willamette Valley in early January 2022. This session was aimed to allow USACE members to become more familiar with CW3E’s available tools and to better understand how they can be utilized to better interpret the forecast. Lastly a brief tour and demonstration of the CW3E website was provided.

This was a great opportunity to share information between CW3E and the Portland District as the FIRO program is beginning to assess transferability through a screening process.