CW3E Publication Notice
The Role of Air‐sea Interactions in Atmospheric Rivers: Case Studies Using the SKRIPS Regional Coupled Model
March 31, 2021
Rui Sun, a postdoc at CW3E, recently published a paper (Sun et al., 2021) in the Journal of Geophysical Research: Atmospheres along with co-authors from CW3E/Scripps (Aneesh C. Subramanian, Bruce D. Cornuelle, Matthew R. Mazloff, Arthur J. Miller, F. Martin Ralph), Woods Hole Oceanographic Institution (Hyodae Seo), and King Abdullah University of Science and Technology (Ibrahim Hoteit). This study contributes to the goals of CW3E’s 2019-2024 Strategic Plan to support Atmospheric River (AR) Research and Applications, and Subseasonal to Seasonal Prediction of Extreme Weather, by developing and testing a coupled modeling system to improve atmospheric river prediction on a sub-seasonal to seasonal scale.
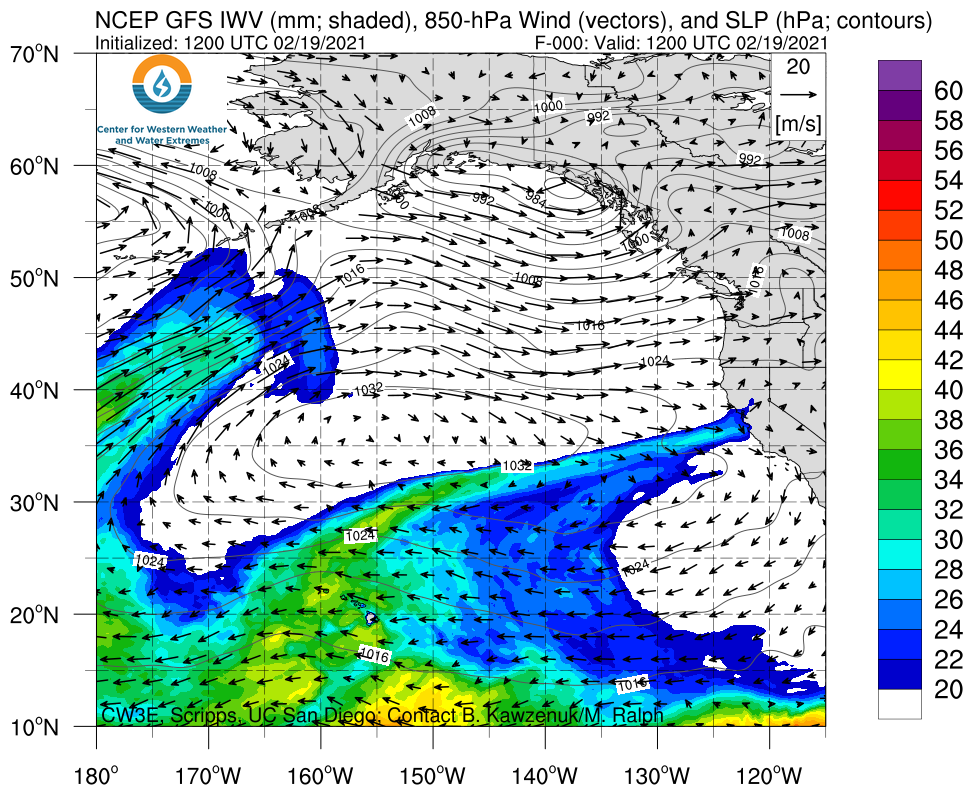
Given the high societal impact of ARs, it is critical to improve our understanding and prediction of ARs. This study uses a regional coupled ocean–atmosphere modeling system to make hindcasts of ARs up to 14 days. Two groups of coupled runs are highlighted in the comparison: (1) ARs occurring during times with strong SST cooling and (2) ARs occurring during times with weak SST cooling. During the events with strong SST cooling, the coupled model simulates strong upward air–sea heat fluxes associated with ARs; on the other hand, when the SST cooling is weak, the coupled model simulates downward air–sea heat fluxes in the AR region.
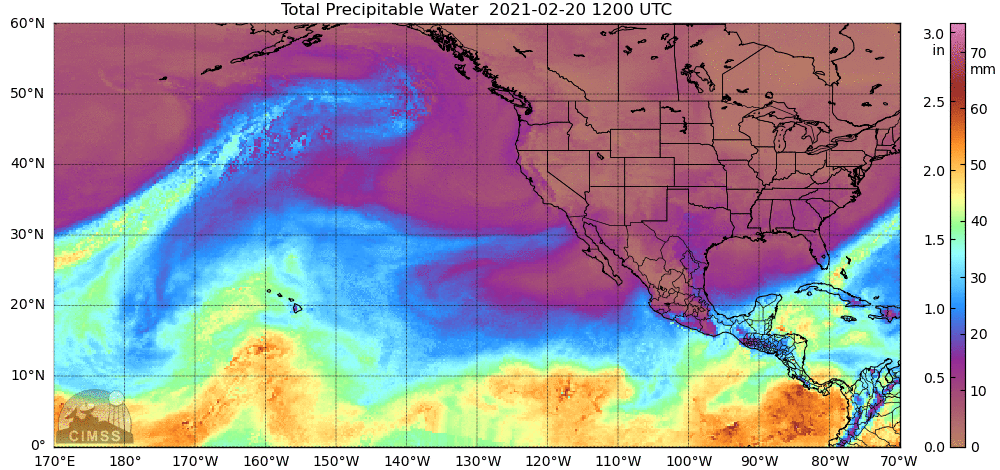
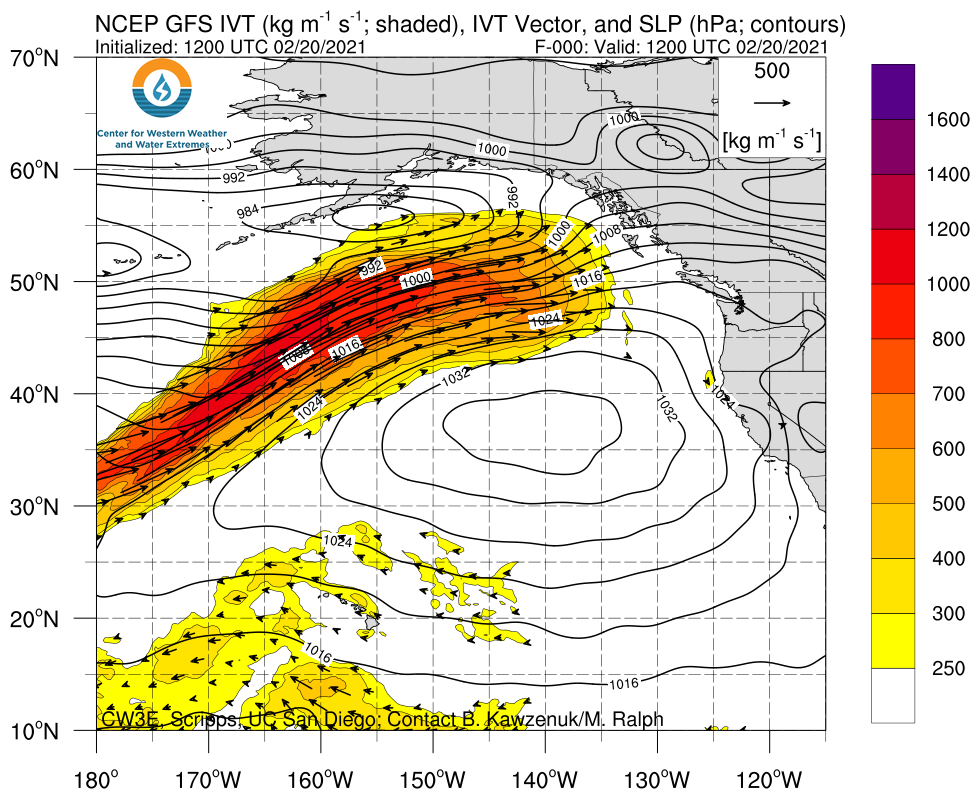
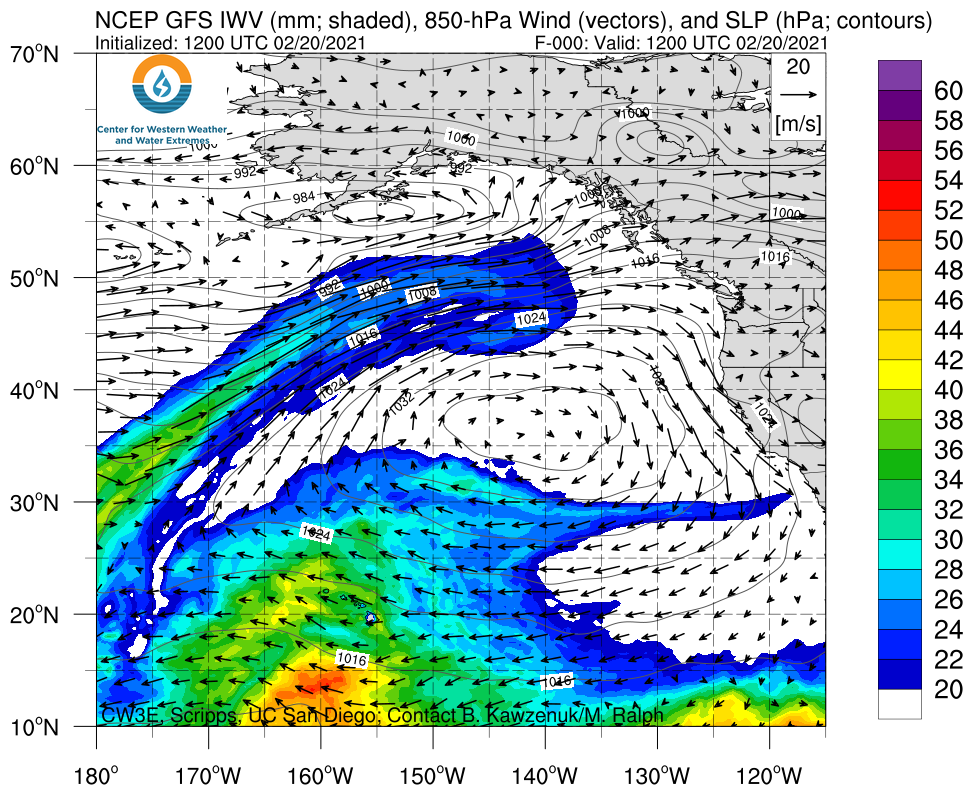
Validation data shows that the coupled model skillfully reproduces the evolving SST, as well as the surface turbulent heat transfers between the ocean and atmosphere. The roles of air–sea interactions in AR events are investigated by comparing coupled model hindcasts to hindcasts made using persistent sea surface temperature (SST). To evaluate the influence of the ocean on ARs we analyze two representative variables of AR intensity, the vertically integrated water vapor (IWV) and integrated vapor transport (IVT). During strong SST cooling AR events the simulated IWV is improved by about 12% in the coupled run at lead times greater than one week. For IVT, which is about twice more variable, the improvement in the coupled run is about 5%.
In this work, we used a regional model to show that for runs out to 14 days coupling to an ocean model improved the simulation of AR characteristics. Future work will involve exploring the response of SST to the atmosphere and ocean state (e.g., heat fluxes, wind stress, mixed layer deepening), the impact of the annual SST cycle, and other characteristics of ARs (e.g., AR intensity, orientation) on the coupling.
Figure 1: The schematic description of the SKRIPS regional coupled ocean–atmosphere model. The yellow block is the ESMF/NUOPC coupler; the white blocks are the ocean and atmosphere components; the red blocks are the implemented MITgcm–ESMF and WRF–ESMF interfaces.
Figure 2: Comparison of BSSIWV and BSSIVT between the coupled run and uncoupled run driven by persistent SST. The simulation results are validated using ERA5. Panels (a) and (b) show BSSIWV and BSSIVT, respectively. The markers are the mean BSSs and the error bars are the standard errors of the mean. The inset figures are the box plots of the BSSs that shows the median, the upper/lower quartiles, and the maximum/minimum RMSEs.
Sun, R., Subramanian, A. C., Cornuelle, B. D., Mazloff, M. R., Miller, A. J., Ralph, F. M., et al. (2021). The role of air‐sea interactions in atmospheric rivers: Case studies using the SKRIPS regional coupled model. Journal of Geophysical Research: Atmospheres, 126, e2020JD032885. https://doi.org/10.1029/2020JD032885.