CW3E AR Update: 10 January 2022 Outlook

CW3E AR Update: 10 January 2022 Outlook

January 10, 2022

Click here for a pdf of this information.

Long-duration Atmospheric River to Bring Heavy Rainfall to Washington and British Columbia

  • AR activity and heavy precipitation is expected over much of the western US today through Friday
  • An atmospheric river (AR) is forecasted to make landfall over Washington and Oregon later this evening
  • An AR 3 (based on the Ralph et al. 2019 AR Scale) is forecasted in coastal Washington and northern coastal Oregon, where AR conditions are expected to persist for more than 48 consecutive hours
  • There is still some uncertainty in the timing and magnitude of maximum IVT, as well as the overall duration of AR conditions
  • More than 7 inches of precipitation are forecasted over portions of the Olympic Peninsula and Vancouver Island
  • Flooding is possible in western Washington and southwestern British Columbia due to the combination of heavy rainfall, moist soils, and existing snowpack at lower elevations
  • High freezing levels will increase the potential for rain-on-snow, which may exacerbate surface runoff and flooding

Click images to see loops of GFS IVT & IWV forecasts

Valid 1200 UTC 10 January – 1200 UTC 13 January 2022


Summary provided by C. Castellano, S. Roj, J. Kalansky, and F. M. Ralph; 10 January 2022

To sign up for email alerts when CW3E post new AR updates click here.

*Outlook products are considered experimental

CW3E Publication Notice: Evaluating the Meteorological Conditions Associated With Dusty Atmospheric Rivers

CW3E Publication Notice

Evaluating the Meteorological Conditions Associated With Dusty Atmospheric Rivers

January 6, 2022

Recent CW3E PhD graduate student, Dr. Kara Voss, along with co-authors Dr. F. Martin Ralph and Dr. Amato T. Evan (CW3E/Scripps Institution of Oceanography), recently published an article in Journal of Geographic Research: Atmospheres, titled “Evaluating the Meteorological Conditions Associated With Dusty Atmospheric Rivers”. The paper contributes to the goals of CW3E’s 2019-2024 Strategic Plan to support Atmospheric River (AR) Research and Applications by advancing our scientific understanding of the development of dusty ARs.

This study aims to understand the drivers of ARs embedded within dusty environments, or “dusty ARs,” defined by Voss et al. as the top 100 AR days in later winter and early spring (February–April) from 2001 through 2018, compared to ARs in more pristine environments. Dust has the potential to increase precipitation from ARs by initiating ice formation in clouds at relatively warm temperatures. Utilizing an 18-year record of the dust content of AR surroundings combined with satellite, reanalysis, and observational meteorological data, the study investigates the following questions: What meteorological features are associated with dusty ARs a) over dust source regions and b) over the North Pacific, and how do these meteorological features differ from features associated with pristine ARs, defined here as the bottom 100 AR days in late winter and early spring (February–April) when ranked by dust score?

The study finds dusty ARs to be associated with transport of dust from the east Asian coast to North America. Dusty ARs are characterized by conditions that are especially conducive to transport of dust across the Pacific; namely, enhanced mid- to upper-tropospheric westerly winds over Asian dust source regions and over the Pacific. In contrast, ARs in more pristine environments are associated with a persistent ridge over the central Pacific, which blocks zonal westerly flow, as well as continental dust. The study also notes that while trans-Pacific dust is largely confined to the 600–200 hPa levels as it is transported across the Pacific, as it nears the storms impacting the western U.S. this dust flows downward along post-cold frontal isentropic surfaces into the AR environment in the lower troposphere. The conceptual model presented in Figure 1 summarizes the steps in the development of dusty ARs, suggested by Voss et al.’s findings.

While complex questions remain regarding the relative impacts of dusty ARs, this study fills a critical research gap in our understanding of these events, offering insight to the conditions and drivers that lead to their development.

Figure 1: Conceptual model of the development of a dusty AR. The mustard yellow meandering arrow represents transported dust. The blue and red circles represent high and low mid- and upper-level geo-potential heights, respectively, and the broken blue arrows indicate the direction of movement of the trough. The blue solid arrow represents the North Pacific Jet. The panel in the top right corner represents forced descent of dust from near 400 hPa to 800 hPa across the cold-frontal region of the extra-tropical cyclone.

Voss, K. K., Evan, A. T., & Ralph, F. M. (2021). Evaluating the meteorological conditions associated with dusty atmospheric rivers. Journal of Geophysical Research: Atmospheres, 126, e2021JD035403. https://doi. org/10.1029/2021JD035403

CW3E Event Summary: 22 December 2021 – 1 January 2022

CW3E Event Summary: 22 December 2021 – 1 January 2022

January 5, 2022

Click here for a pdf of this information.

Atmospheric River and Upper-Level Systems Bring Heavy Rain and Snow to the Western US

  • An atmospheric river (AR) made landfall over California on 22 Dec and gradually strengthened as it spread across the interior southwestern US
  • AR 2/AR 3 conditions (based on the Ralph et al. 2019 AR Scale) were observed over coastal Central and Southern California
  • Significant inland penetration of this AR produced AR 3 conditions over southern Arizona and heavy snow in the Upper Colorado River Basin
  • After the AR dissipated, a series of upper-level shortwaves brought additional rain and heavy snow to much of the western US
  • Low freezing levels allowed for accumulating snowfall in the lower elevations of Washington, Oregon, and Northern California
  • Portions of the Sierra Nevada, the Southern California Transverse Ranges, and the Sawatch Range in Colorado received more than 10 inches of total precipitation
  • Several feet of snow fell across the Cascades, the Sierra Nevada, and the Intermountain West, with the heaviest snowfall (> 10 feet) near Lake Tahoe and in western Colorado
  • These storms produced dramatic increases in snowpack in the Sierra Nevada and Upper Colorado River Basin
  • As of 1 Jan, statewide snowpack in California was 154% of normal, and statewide water-year-to-date precipitation had already exceed the statewide total precipitation during WY 2021
  • Heavy snow in the Sierra Nevada caused major travel disruptions and numerous power outages

Click images to see loops of GFS IVT/IWV analyses

Valid 0000 UTC 20 December – 1800 UTC 25 December 2021


Summary provided by C. Castellano, C. Hecht, S. Roj, J. Cordeira, J. Kalansky, B. Kawzenuk, F.M. Ralph; 5 January 2022

To sign up for email alerts when CW3E post new AR updates click here.

*Outlook products are considered experimental

CW3E AR Update: 22 December 2021 Outlook

CW3E AR Update: 22 December 2021 Outlook

December 22, 2021

Click here for a pdf of this information.

Strong Atmospheric River and Multiple Upper-level Systems to Produce Heavy Rain and Snow in the Western US

  • AR activity and heavy precipitation is expected over much of the western US today through Friday
  • The 12Z GEFS control member is forecasting AR 2/AR 3 conditions over coastal Southern and Central California
  • AR 5 conditions are currently forecasted over south-central Arizona, where maximum IVT magnitude may exceed 1250 kg m -1 s -1
  • As the AR weakens, a series of upper-level shortwave troughs is forecast to move down along the US West Coast and bring additional periods of precipitation to the Pacific Northwest and Northern California
  • Freezing levels are forecasted to decrease starting on 23 Dec to 3000-4000 ft and remain below 5000 ft during the passing of the shortwaves
  • A second period of AR activity is possible over the southwestern US on 25–26 Dec
  • The NWS Weather Prediction Center (WPC) is forecasting at least 5–10 inches of total precipitation in portions of the Pacific Coast Ranges, the Cascades, and the Sierra Nevada over the next 7 days, with more than 10 inches likely in the higher terrain of the Sierra Nevada
  • At least 2–5 inches of precipitation are forecasted in Southern California and parts of the Rocky Mountains in Utah, Colorado, Idaho, and Wyoming with up to 2.5 inches in parts of Arizona
  • More than 8 feet of snow are possible in the higher terrain of the Sierra Nevada
  • Although significant flooding is not expected at this time, minor flooding is possible in the vicinity of the Central California Coast Ranges and the mountains in Southern California

Click images to see loops of GFS IVT & 500-hPa vorticity forecasts

Valid 1200 UTC 22 December – 0000 UTC 30 December 2021


Summary provided by C. Castellano, S. Roj, J. Kalansky, and F. M. Ralph; 22 December 2021

To sign up for email alerts when CW3E post new AR updates click here.

*Outlook products are considered experimental

CW3E AR Update: 20 December 2021 Outlook

CW3E AR Update: 20 December 2021 Outlook

December 20, 2021

Click here for a pdf of this information.

Atmospheric River Conditions are Forecast Over the US West Coast this Week with Heavy Precipitation in California

  • AR activity is forecasted to bring stormy conditions from the Pacific Northwest to Baja California this week
  • The current AR and its parent low continue to bring rain to parts of the Pacific Northwest through tomorrow afternoon
  • The break will be short-lived though, as additional precipitation moves onshore in association with multiple shortwave troughs
  • The trough associated with the current AR is expected to cut off from the main flow and weaken
  • As it weakens, tropical moisture is exported towards Southern California and Baja California as part of the 2nd AR
  • There is still considerable uncertainty in the timing, magnitude, and duration of AR conditions and precipitation
  • The 12Z GEFS control member is forecasting AR 4 conditions for northern Baja California and AR 3 conditions in San Diego County
  • Over the next seven days, the NWS Weather Prediction Center (WPC) is forecasting 5–10 inches of total precipitation (locally > 10 inches) over the Sierra Nevada and 1–3 inches of total precipitation over coastal Southern California, the Transverse Ranges, and the Peninsular Ranges
  • Several feet of snow are possible in the Sierra Nevada

Click images to see loops of GFS IVT & 500-hPa vorticity forecasts

Valid 1200 UTC 20 December – 0000 UTC 28 December 2021


Summary provided by S. Roj, C. Castellano, J. Kalansky, and F. M. Ralph; 20 December 2021

To sign up for email alerts when CW3E post new AR updates click here.

*Outlook products are considered

CW3E Publication Notice: Assessment of a post-fire debris flow impacting El Capitan Watershed, Santa Barbara County, California, USA

CW3E Publication Notice

Assessment of a post-fire debris flow impacting El Capitan Watershed, Santa Barbara County, California, USA

December 20, 2021

J. Y. Schwartz (US Forest Service), N.S. Oakley (CW3E), P. Alessio (UCSB)

Click here for a personal use pdf of this article.

The 2016 Sherpa Fire burned 7,500 acres along the southern slope of the Santa Ynez Mountains west of Santa Barbara. A high-intensity rainfall event on January 20th 2017 initiated debris flows and sediment laden flooding in several recently burned watersheds, causing major damage to property and infrastructure primarily in El Capitan Canyon, El Capitan State Beach, and an oil and gas facility in Cañada del Corral. The authors document the conditions leading up to and outcomes of this impactful post-fire debris flow event.

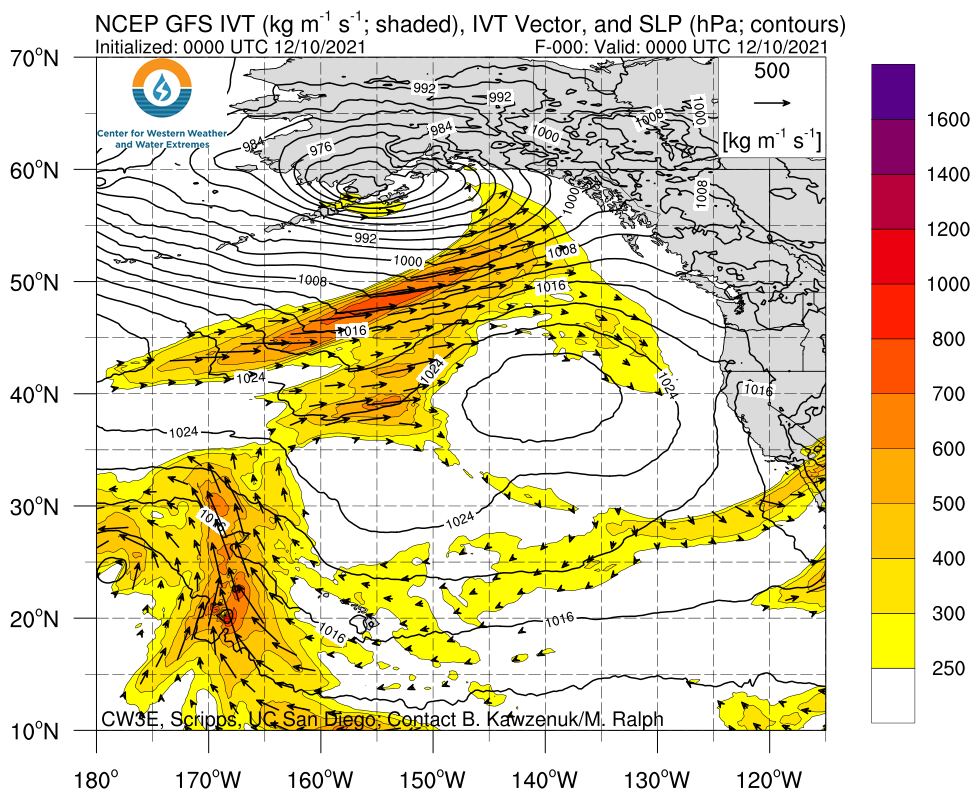
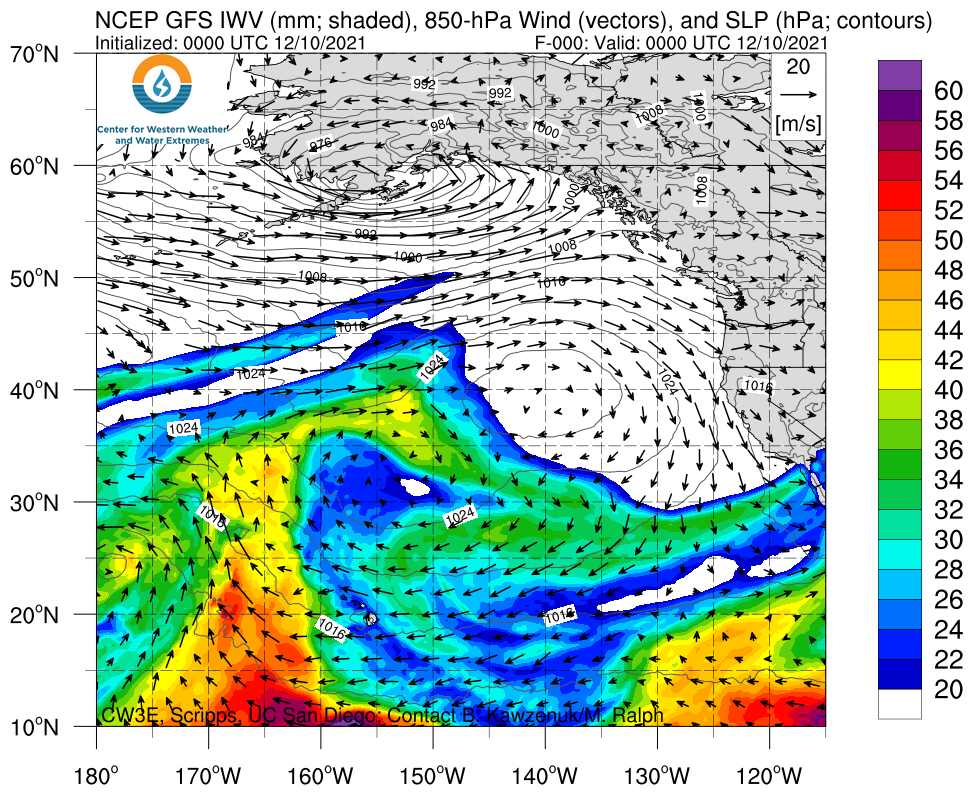
Approximately 64% of the Sherpa Fire area experienced moderate to high soil burn severity. The area also features steep terrain and erodible soils, all conditions conducive to post-fire debris flow hazards. The high-intensity rainfall triggering the debris flows occurred within a weak-to-moderate atmospheric river, driven by a mesoscale vortex that developed and tracked west-to-east along the Santa Ynez Mountains. Peak rainfall intensities reached 0.75 inches in 15 minutes, a rate of 3 in/h, well over the debris flow-triggering threshold of 0.28 inches in 15 minutes (a rate of 1.1 in/h) advised in the final report by the Burned Area Emergency Response team for the first wet season following the fire.

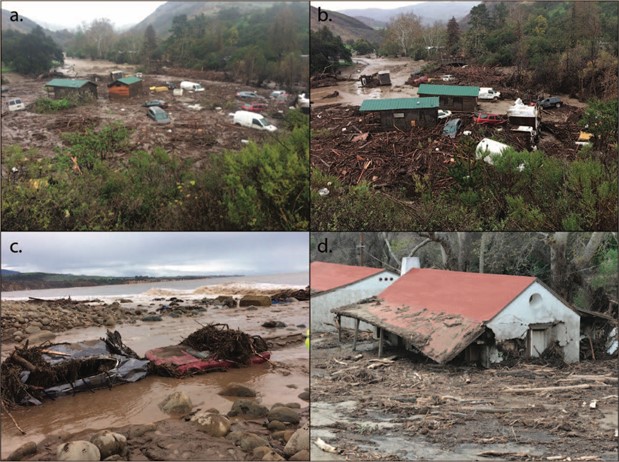
Impacts of the post-fire debris flow in El Capitan Canyon (a-c) and Cañada del Corral (d).

No fatalities were reported, though 22 people were trapped in cabins and required immediate rescue from first responders. Nine cabins were destroyed and as many as 21 vehicles were carried away, some reaching the ocean. Boulders and woody debris clogged culverts and underpasses, contributing to the flooding and various impacts observed beyond the damage to cabins and vehicles, including impacts to infrastructure such as roads, bridges, and pipelines.

The documentation of damaging post-wildfire debris flow events like this one highlights the susceptibility to post-fire debris flows in the Santa Ynez Mountains and other mountainous regions of the southwestern US. This event occurred just one year prior to the devastating 9 January 2018 post-fire debris flow in Montecito that killed 23 people. In 2021, the Alisal Fire burned 17,000 acres just west of the Sherpa Fire burn scar, bringing renewed concern for post-fire debris flows to the Santa Ynez Mountains. Documenting conditions and impacts can inform the design of infrastructure, building code, and land use planning to reduce impacts of these hazards. It can also help officials plan for evacuations, impacts, and response prior to and following a post-fire debris flow.

This article appears in a special issue of Environmental and Engineering Geology honoring the legacy of Jerome (Jerry) DeGraff. Over his career, Jerry made important contributions to our understanding of natural hazards, reducing risk and protecting life and property, and providing scientific guidance to inform public policy. The full special issue can be accessed here.

The event described in this research occurred within an atmospheric river (AR) and describes the impacts of mesoscale phenomena embedded within an AR, addressing the CW3E values of AR research and applications. This work also addresses the CW3E value of monitoring of climate variability and change, as it documents an extreme high-intensity rainfall event and its impacts. Additionally, this research highlights CW3E’s core value of collaboration, as this is a collaboration across disciplines (geology and atmospheric science) as well as across agencies and universities (CW3E/UCSD, US Forest Service, and UCSB).

Schwartz, J. Y., Oakley, N.S., Alessio, P.; Assessment of a Post-Fire Debris Flow Impacting El Capitan Watershed, Santa Barbara County, California, U.S.A. Environmental and Engineering Geoscience 2021; 27 (4): 423–437. doi: https://doi.org/10.2113/EEG-D-21-00008

CW3E Event Summary: 10-14 December 2021

CW3E Event Summary: 10-14 December 2021

December 16, 2021

Click here for a pdf of this information.

Atmospheric River Brings Heavy Rain and Snow to the Western US

  • An atmospheric river (AR) made landfall over the Pacific Northwest on 10 Dec and gradually moved south along the US West Coast
  • When the AR reached the San Francisco Bay Area, it temporarily stalled and began to re-intensify as it interacted with an upper-level trough to the west
  • AR conditions persisted for at least 48 hours over the Bay Area and the foothills of the Northern Sierra Nevada, resulting in an AR 2/AR 3 (based on the Ralph et al. 2019 AR Scale)
  • AR 1 conditions were observed in coastal Southern California
  • More than 5 inches of storm-total precipitation fell across the Pacific Coast Ranges, the Cascades, the Sierra Nevada, and the Southern California Transverse Ranges
  • Some locations in the California Coast Ranges reported more than 10 inches of precipitation
  • Several feet of snow fell in the Olympic Mountains, the Cascades, the Northern Rockies, and the Sierra Nevada
  • Low freezing levels supported significant snowfall accumulations below 6,000 feet in the Sierra Nevada as well as in the Southern Oregon and Northern California Coast Ranges
  • Intense rainfall on 13–14 Dec caused flooding and slides in the Bay Area and in Southern California

Click images to see loops of GFS IVT/IWV analyses

Valid 0000 UTC 10 December – 0000 UTC 15 December 2021


Summary provided by Chris Castellano, J. Kalansky, Shawn Roj, F.M. Ralph; 16 December 2021

To sign up for email alerts when CW3E post new AR updates click here.

*Outlook products are considered experimental

CW3E Releases Update to California Watershed Precipitation Forecasts

CW3E Releases Update to California Watershed Precipitation Forecasts

December 13, 2021

The Center for Western Weather and Water Extremes at the UCSD/Scripps Institution of Oceanography has updated its popular watershed precipitation forecasts as part of its interactive “Decision Support Tools” page. These forecasts focus on quantifying and illustrating the 10-day precipitation forecasts averaged for the 126 Hydrologic Unit Code 8 (HUC-8) watersheds in California from four numerical weather prediction models. These models include the deterministic and ensemble models of the National Centers for Environmental Prediction Global Forecast System and the European Centre for Medium-Ranged Weather Forecasts model.

The webpage now features enhanced interactivity over its predecessor with improved navigation, additional quantitative information, point-and-click interaction, and the addition of ensemble information. An example of the precipitation forecast from the ECMWF ensemble model for the Upper Yuba watershed from 13 December 2021 is shown below:

The left panel illustrates the 10-day watershed mean areal precipitation forecast from the ECMWF ensemble mean (in.; shaded according to scale, with an option to change this map to the 5-day precipitation). The upper-right panel contains a list of California watersheds sorted by their 10-day (or 5-day) precipitation; this table is sortable, clickable, and linked to the map. Selecting a watershed on the map or the table will generate a time series of the precipitation forecast for the watershed in the lower-right panel with the 6-h precipitation rate in blue ensemble accumulated precipitation drawn as gray lines, ensemble mean in red, and ensemble control in black.

The webpage also features a robust means of visualizing and comparing the GFS and ECMWF model ensemble forecasts of precipitation across watersheds and for a specific watershed. The addition of the multi-model full distributions of ensemble member forecasts will allow for an improved assessment of possible precipitation outcomes associated with landfalling atmospheric rivers and an increased awareness of the potential for extreme precipitation in California watersheds. The image below illustrates a overlapping comparison of the GFS and ECMWF forecasts for the Upper Yuba River watershed initialized at 0000 UTC on 13 December 2021:

The chart illustrates the 10-day watershed mean areal precipitation forecast at the Upper Yuba River for the GFS (red) and ECMWF (blue) ensembles. Bars illustrate the six-hour precipitation on the left axis and lines illustrate the accumulated precipitation on the right axis, with the ensemble mean drawn as a thicker line with annotation.

The watershed analyses and forecasts produced by CW3E support atmospheric rivers research and applications with a key objective to produce forecasting and decision support tools that meet the needs of western U.S. forecasts, resource managers, and emergency managers. The development and maintenance of this specific set of tools is supported by the California Atmospheric Rivers Program.

Contact: Dr. Jay Cordeira | jcordeira@ucsd.edu

CW3E AR Update: 10 December 2021 Outlook

CW3E AR Update: 10 December 2021 Outlook

December 10, 2021

Click here for a pdf of this information.

A long duration atmospheric river is forecast to bring substantial snowfall to the West Coast’s mountains this weekend and into next week

  • The AR is forecast to initially make landfall over the Pacific Northwest on Saturday morning, bringing IVT magnitudes between 600 and 700 kg/ms to coastal Washington and Oregon
  • The AR is then forecast to weaken as it moves southward over the coast, eventually bringing weak AR conditions to the San Francisco Bay Area before stalling
  • As the weak AR is stalled over the Northern California Coast, a separate frontal system is forecast to merge with the weak AR, intensifying and prolonging AR conditions over the region
  • The GEFS is currently exhibiting high ensemble spread in association with the merger of the two separate systems over Northern California, resulting in high uncertainty in timing and magnitude of the re-intensification of the AR and the overall duration of the event
  • The combination of low-freezing levels and the long duration of the event will result in substantial snowfall of 5 – 8 feet over the Sierra Nevada, resulting in treacherous travel conditions but an extremely beneficial contribution to the depleted California snowpack

Click images to see loops of GFS IVT & IWV forecasts

Valid 1200 UTC 10 December – 0000 UTC 20 December 2021


Summary provided by C. Hecht, C. Castellano, S. Roj, B. Kawzenuk, J. Kalansky, and F. M. Ralph; 10 December 2021

To sign up for email alerts when CW3E post new AR updates click here.

*Outlook products are considered experimental