CW3E Publication Notice: Characteristics, Origins, and Impacts of Extreme Summertime Precipitation in the Lake Mead Watershed

CW3E Publication Notice

Characteristics, Origins, and Impacts of Extreme Summertime Precipitation in the Lake Mead Watershed

December 2, 2019

CW3E graduate student Mike Sierks, along with co-authors Julie Kalansky, Forest Cannon, and Marty Ralph, published a paper in Journal of Climate entitled, “Characteristics, Origins, and Impacts of Extreme Summertime Precipitation in the Lake Mead Watershed.” This research is part of CW3E’s efforts to better understand the origins of extreme precipitation events in the Western U.S.. It extends CW3E’s efforts on the Southwest Monsoon from Southeast Arizona, which was the focus of an earlier paper (Ralph and Galarneau 2017), to the Northern Arizona region. This improved understanding has the potential to enable better predictions of extreme monsoon precipitation and has applications to flood risk management and water supply.

The North American Monsoon (NAM) is the main driver of summertime climate variability in the American southwest. Previous studies of the NAM have primarily focused on the Tier I region of the North American Monsoon Experiment (NAME), spanning central-western Mexico, southern Arizona and New Mexico. This manuscript, however, presents a climatological characterization of summertime precipitation, defined as July, August, and September (JAS), in the Lake Mead watershed, located in the NAME Tier II region. Spatiotemporal variability of JAS rainfall is examined from 1981-2016 using gridded precipitation data and the meteorological mechanisms that account for this variability are investigated using reanalyses. The importance of the number of wet days (24-hr rainfall ≥1 mm) and extreme rainfall events (95th percentile of wet days) to the total JAS precipitation are examined and show extreme events playing a larger role in the west and central basin.

An investigation into the dynamical drivers of extreme rainfall events indicates that anticyclonic Rossby wave breaking (RWB) in the midlatitude westerlies over the US west coast is associated with 89% of precipitation events >10 mm (98th percentile of wet days) over the Lake Mead basin. This is in contrast to the NAME Tier I region where easterly upper-level disturbances such as inverted troughs are the dominant driver of extreme precipitation. Due to the synoptic nature of RWB events, corresponding impacts and hazards extend beyond the Lake Mead watershed and are relevant for the greater U.S. southwest.

Figure 1 demonstrates the upper-level synoptic environment associated with a RWB event associated with extreme precipitation and high impact weather across the southwestern US in September 2007.

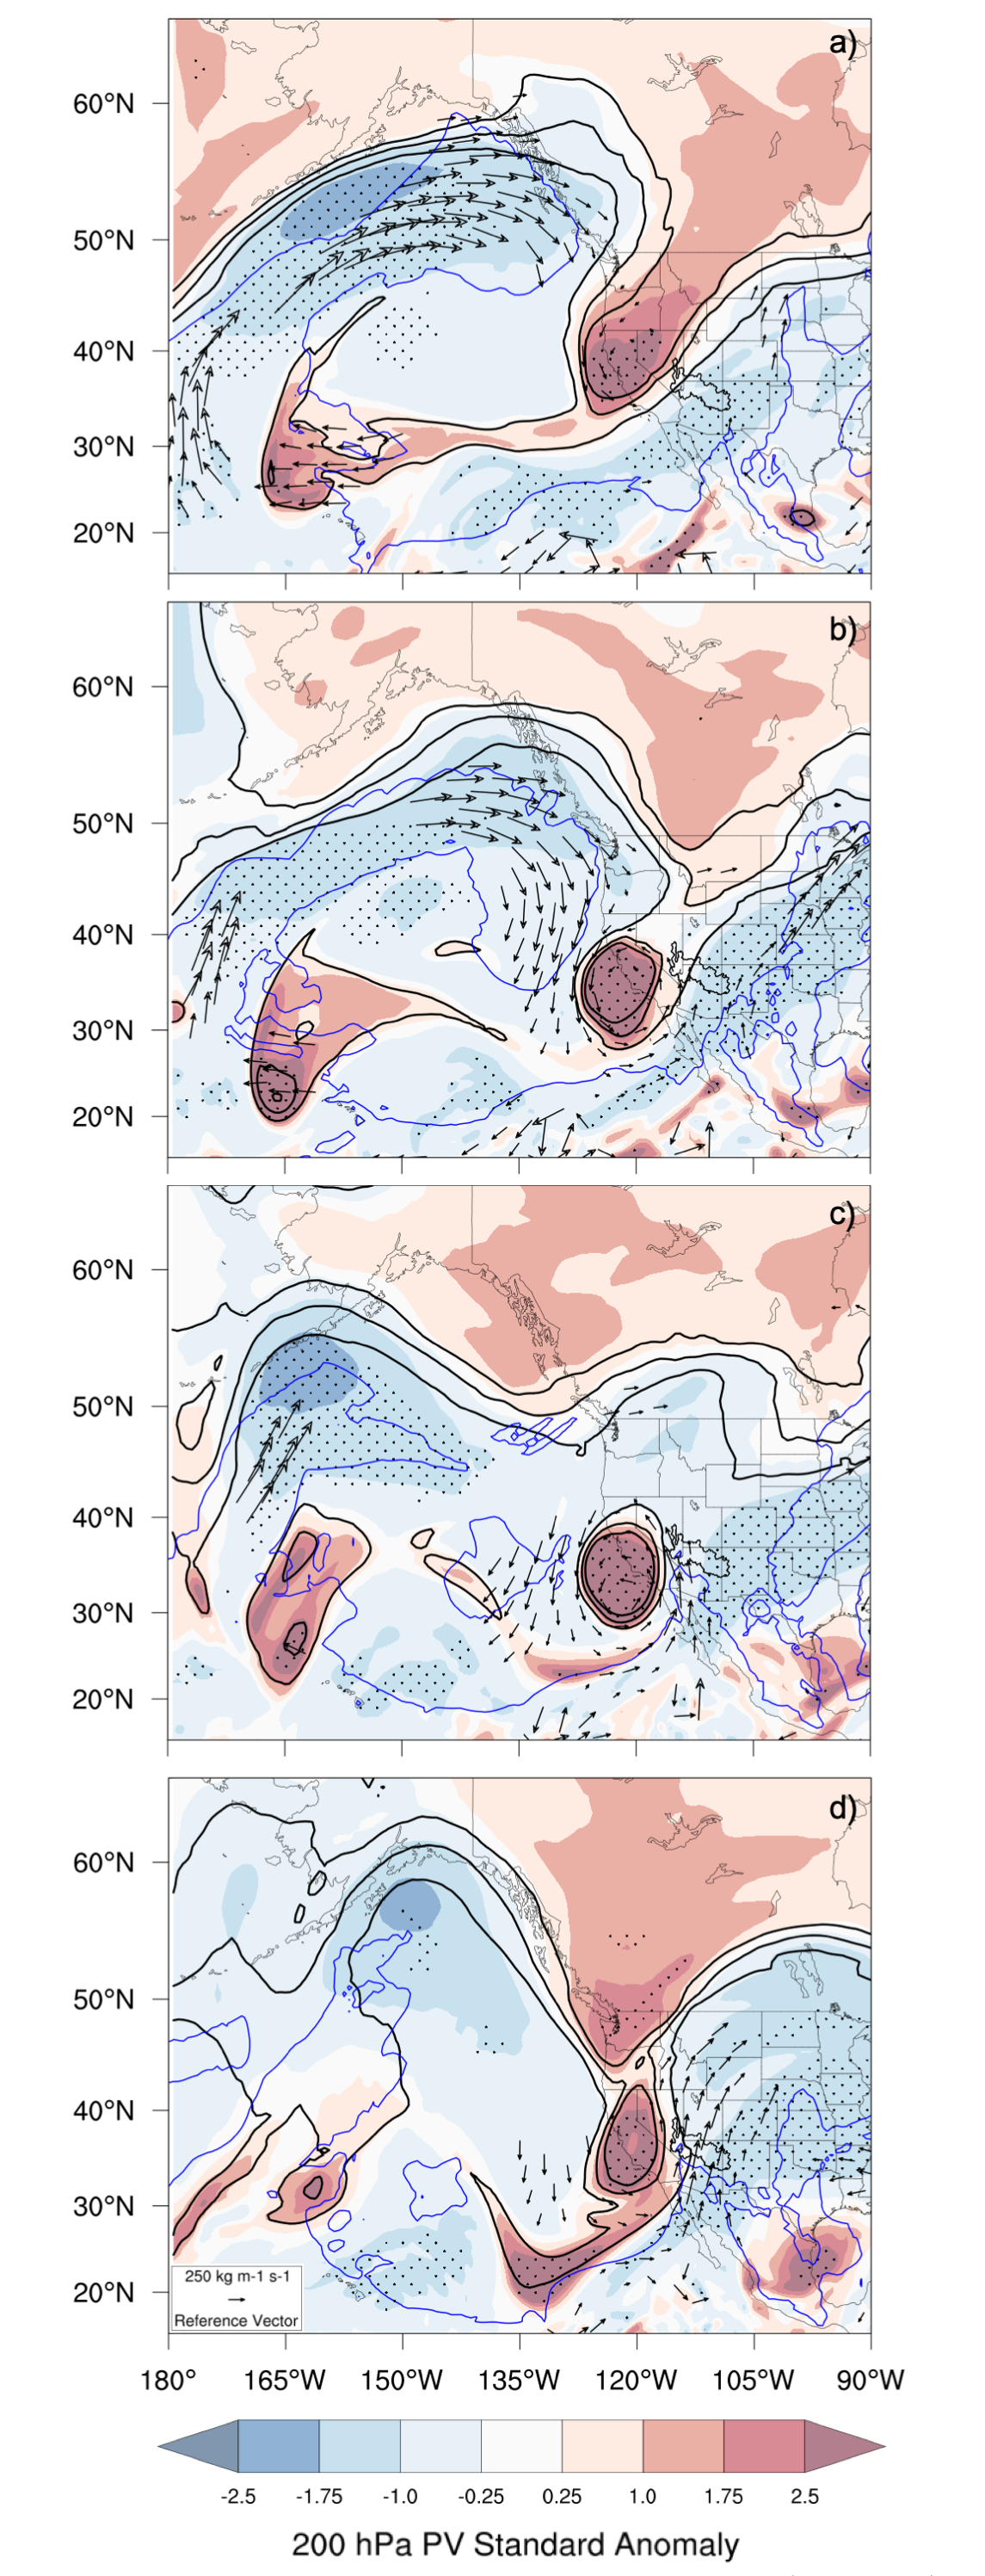
Figure 1: Composite fields for combined ‘canonical’ and ‘TC tapping’ RWB cases (n=16) in the combined Lake Mead watershed on day of extreme precipitation for (a) 200-hPa potential vorticity standardized anomaly (shaded), 200-hPa potential vorticity (black contours, shaded every 2 PVU starting at 2 PVU), and (b) 500-hPa geopotential height standardized anomaly (shaded), 500-hPa geopotential height (black contours, shaded every 50 m starting at 5850 m). IVT vectors significant at the 95th percentile are shown. Stippling indicates statistical significance of standard anomaly field at the 95th percentile. The Lake Mead watershed is outlined in a thin black line.

Figure 2 contrasts the idealized synoptic set-ups for the primary drivers of extreme precipitation for the Lake Mead watershed (RWB and Inverted Trough (IV)) during the summertime.

Figure 2: Idealized synoptic set-ups for primary drivers of extreme precipitation in the Lake Mead watershed, (a) RWB (b) IV (adapted from Pytlak et al., 2005), and their corresponding characteristic meteorology. The fraction of extreme events for the entire Lake Mead watershed associated with each regime is denoted above each panel. The Lake Mead watershed is outlined in a thin black line.

Sierks, M.D., J. Kalansky, F. Cannon, and F. Ralph, 2019: Characteristics, Origins, and Impacts of Summertime Extreme Precipitation in the Lake Mead Watershed. J. Climate, 0, https://doi.org/10.1175/JCLI-D-19-0387.1.

CW3E AR Update: 27 November Event Summary & Outlook

CW3E AR Update: 27 November Event Summary & Outlook

November 27, 2019

Click here for a pdf of this information.

A strong and rapidly intensifying cyclone made landfall over Northern CA and Southern OR resulting in numerous impacts

  • A cyclone that underwent rapid intensification moved onshore over Northern CA and Southern OR, bringing strong winds, high precipitation rates, and heavy snow
  • A narrow cold frontal rain band developed in association with the fast-moving and dynamically robust cold front and brought
    high rain rates to portions of coastal Northern and Central California
  • Cape Blanco in Southern OR experienced sustained winds of 85 mph and a maximum gust of 106 mph in association with the
    strong landfalling cyclone
  • The strong winds produced wave heights as high as 34 feet off the coast of Northern CA and the all-time low pressure
    measurement for the state of California was preliminarily set in Crescent City of 973.6 hPa
  • Both Interstate 5 and 80 have been closed in sections due to heavy snow and whiteout conditions during one of the busiest
    travel weeks of the year


Active weather pattern over Western U.S. will persist into early next week

  • Multiple landfalling ARs over western North America will impact the U.S. Southwest during the next 48 hours
  • There is increasing forecast confidence in the likelihood of a long-duration AR event in California starting 30 Nov
  • Total precipitation amounts over the next 7 days may exceed 5 inches in some locations
  • Click IVT or IWV image to see loop of GFS analyses/forecasts

    Valid 1200 UTC 26 November – 0000 UTC 4 December 2019


    Summary provided by C. Castellano, C. Hecht, B.Kawzenuk, J. Kalansky, F. M. Ralph; 4 PM PT 27 November 2019

CW3E Field Team Starts Meteorology and Radar Instrument Installations in Feather and Yuba Watersheds

CW3E Field Team Starts Meteorology and Radar Instrument Installations in Feather and Yuba Watersheds

November 22, 2019

The CW3E Field Team along with interns and volunteers worked to install meteorology, soil moisture, and radar instruments in the Feather and Yuba watersheds over the course of September – November. The team installed two soil moisture and surface meteorology arrays and a Micro Rain Radar, focusing on the high precipitation region of the watersheds. The Feather and Yuba watersheds introduce a new challenge of observing the meteorological and hydrological impacts of ARs on watersheds in the rain-snow transition of the Sierra Nevada. An additional soil moisture and meteorology array and an additional Micro Rain Radar are planned to be installed in the watersheds prior to the 2019-20 AR season for a total of three soil moisture and meteorology arrays and two MicroRain Radars. Three more soil moisture and meteorology stations will be installed next year. These installations add the Oroville and New Bullards Bar reservoirs to the Forecast Informed Reservoir Operations (FIRO) project, which assesses the potential to enhance water resources and flood control operations with hydrometeorological forecast data. Maintenance work was also conducted on all sites in the Russian River to support Lake Mendocino FIRO activities. For more information on FIRO, visit the FIRO web page. CW3E thanks the landowners who have volunteered to have instruments installed on their properties.

Photos from field installations in the Yuba/Feather watersheds and maintenance visits in the Russian River basin during Fall 2019.

CW3E AR Update: 25 November Outlook

CW3E AR Update: 25 November Outlook

November 25, 2019

Click here for a pdf of this information.

Period of active weather to bring impacts to a large majority of the Western United States

  • A cyclone is forecast to undergo rapid intensification over the northeastern Pacific before moving inland over Northern CA
  • While the parent cyclone associated with this event is forecast to be strong, the AR is forecast to be fast moving and of relatively low moisture content, which will result in primarily beneficial instead of hazardous rainfall
  • The primary impacts associated with this event will be strong winds over North-Coastal California (gusts >50 mph) and heavy snow (>3 feet) over the high elevations of California
  • A second cyclone is forecast to intensify over Southern CA and bring additional AR activity to Southern CA and AZ
  • Overall, as much as 2–3 feet of snow could fall above 3,000 ft. (4 feet over the highest elevations) in the Sierra Nevada Mountains whereas Southern CA could receive as much as 2 in. of rain over the next 5 days

Click IVT or IWV image to see loop of 0-105 hour GFS forecasts

Valid 1200 UTC 25 November – 2100 UTC 29 November 2019


Summary provided by C. Hecht, C. Castellano, B.Kawzenuk, J. Kalansky, F. M. Ralph; 4 PM PT 25 November 2019

CW3E Publication Notice: The Atmospheric River Tracking Method Intercomparison Project (ARTMIP): Quantifying Uncertainties in Atmospheric River Climatology

CW3E Publication Notice

The Atmospheric River Tracking Method Intercomparison Project (ARTMIP): Quantifying Uncertainties in Atmospheric River Climatology

November 25, 2019

We are pleased to announce the online publication of a paper entitled, “The Atmospheric River Tracking Method Intercomparison Project (ARTMIP): Quantifying Uncertainties in Atmospheric River Climatology” (Rutz et al. 2019). This paper is the cornerstone of the ARTMIP Tier 1 experiment, in which 20+ researchers applied their atmospheric river (AR) identification and tracking methods to the same data set (MERRA v2), same time period (1980-2017), and overlapping regions of the globe. The result is a rich data set that was used to quantify the uncertainty in current AR climatology that arises due to the number of methods now in the published literature. This paper does so by examining metrics such as AR frequency, duration, seasonality, and many other novel methods of comparison. An example of this uncertainty at one time step is shown in the figure below, which highlights the different spatial footprints of an AR identified by a number of different ARTMIP methods. In general, this study highlights the fact that methods with more restrictive AR identification and tracking criteria tend to have weaker statistics in terms of AR climatology, while the statistics for methods with less restrictive criteria are more robust, as more ARs are identified. The ARTMIP Tier 1 data set is available (housed on the NCAR/UCAR Climate Data Gateway at doi:10.5065/D6R78D1M), and can be used by other researchers to further assess the uncertainty that arises as a result of different AR tracking and identification methods. Future work (ARTMIP Tier 2) will use a similar approach to evaluate the uncertainty of AR climatology under several future climate scenarios.

For more information about ARTMIP, visit the ARTMIP web page.

Figure 1: Example of how AR identification and tracking methods differ over the northeastern Pacific, based on MERRA v2 data from 0000 UTC 15 February 2014. Gray shading represents IVT (kg m-1 s-1), and colored contours represent the spatial regions designated as ARs by the various methods. Note that only algorithms available in this region are shown. Additionally, some methods available for this region do not identify an AR at this time (‘payne’, ‘pnnl1_hagos’,and ‘pnnl2_hq’). Please see Figure 5 and Table 1 in the manuscript for more information about methods shown.

Rutz, J. J., Shields, C. A., Lora, J. M., Payne, A. E., Guan, B., Ullrich, P., et al. (2019): The Atmospheric River Tracking Method Intercomparison Project (ARTMIP): Quantifying Uncertainties in Atmospheric River Climatology. Journal of Geophysical Research: Atmospheres, 124, https://doi.org/10.1029/2019JD030936.

CW3E Welcomes Dr. Ty Brandt

CW3E Welcomes Dr. Ty Brandt

November 20, 2019

Ty Brandt joined CW3E as Postdoc in October 2019. He received his B.S. in Biology from Whitman College (2007), and his M.S. in Environmental Science from California State University Monterey Bay (2012). For his PhD he worked with Dr. Jeff Dozier at the Bren School of Environmental Science and Management at the University of California Santa Barbara (2019).

Ty’s PhD research focused on the use of snow remote sensing and snow modeling to improve our understanding of the spatial distribution of wintertime mountain precipitation. In mountain environments, the dynamic nature in which the atmosphere and land interact can render the spatial distribution of precipitation highly variable. In the past, we have used networks of surface stations to capture this variability, and to make these measurements meaningful we have utilized statistics or models to “fill the gaps”. However, the “gaps” often include vast areas of topographic variability, making model validation challenging at best. Snow, unlike rain however, remains roughly in place post-snowfall, and can be measured both from the ground (using traditional techniques) and now from the air using lidar technology. Ty’s thesis took advantage of this by using lidar collected by the Airborne Snow Observatory (ASO) to establish a methodology for measuring the spatial distribution of snowfall during a single storm. He also used ASO data and snow study sites to directly evaluate the Weather Research and Forecasting (WRF) model’s ability to replicate the spatial patterns in yearly snow accumulation.

At CW3E Ty will provide snow remote sensing, modeling and process understanding to aid WRF modeling studies. Ty’s expertise supports several of CW3E projects including FIRO, NOAA projects and work with the Yuba Water Agency.

CW3E Welcomes Patrick Mulrooney

CW3E Welcomes Patrick Mulrooney

November 19, 2019

Pat joined CW3E as a Domain Science Programmer in October 2019. He earned his B.S. in Mathematics from the University of Illinois at Urbana-Champaign and M.A.S. in Data Science from the University of California, San Diego. After graduating, Pat worked as a research programmer supporting biological sciences at UIUC. While working for the Energy Biosciences Institute at UIUC he helped develop BETYdb, a database that aggregates information on biofuel research. He then moved to a position as a storage engineer at the National Center for Supercomputing Applications where he worked on a variety of projects including the Illinois Campus Cluster and Blue Waters Archive.

In 2014, Pat relocated to San Diego to take a position at San Diego Supercomputer Center as a senior storage engineer. At SDSC, he managed storage to meet the big data needs of researchers at UCSD. Most recently, Pat worked at Rady Children’s Institute for Genomic Medicine as a high-performance computing engineer. While at the institute, he built and maintained the analysis environment that ran the whole genome sequencing to clinical diagnosis pipeline.

Pat looks forward to supporting the complex computing needs of the research being done at CW3E.

CW3E Outlook: 17-22 Nov Cutoff Low

CW3E Outlook: 17-22 Nov Cutoff Low

November 19, 2019

Click here for a pdf of this information.

Cutoff low and subsequent shortwave trough will bring widespread rainfall to the U.S. Southwest

  • A cutoff low pressure system west of the Baja Peninsula will transport large amounts of water vapor into the Southwest in the coming week
  • Meanwhile, a separate storm will drop down the coast from the north, with a decaying atmospheric river, and form a strong closed low that will entrain the weakening cutoff low and its tropical water vapor
  • This second system will then move into the Southwest, producing widespread 1-3 inches of rain and snow (liquid equivalent) over parts of AZ, UT, and southern NV, with over 5 inches of liquid equivalent in parts of Arizona over roughly 4 days
  • Higher elevations may see 2-3 feet of snow accumulation
  • Lower precipitation amounts (less than 1-2 inches) are expected across Southern California and the Southern Sierra Nevada
  • In Arizona, this 4-day period is predicted to produce at least 10-25% (and even as much as 40-50% in some locations) of November-April average total precipitation


Summary provided by F. M. Ralph and N. Oakley; 19 November 2019

CW3E Hosts 11th Annual Winter Outlook Workshop Sponsored by California DWR

CW3E Hosts 11th Annual Winter Outlook Workshop Sponsored by California DWR

November 15, 2019

The 11th Annual Winter Outlook Workshop (WOW), sponsored by the California Department of Water Resources (DWR), took place at Scripps Institution of Oceanography from November 6th-8th, 2019.

The purpose of the WOW meeting, both historically and continuing this year, is to facilitate interaction between the research community and water resource managers on improving subseasonal-to-seasonal (S2S) forecasts of precipitation, atmospheric rivers (ARs), ridging, and other relevant hydroclimate variables for the Western U.S. region.

The 11th Annual WOW meeting began with opening remarks from CW3E Director Dr. Marty Ralph, which was followed by a presentation from Jeanine Jones (DWR Interstate Resources Manager). Her presentation provided an overview of the stakeholder/end user need for better S2S forecasts of precipitation, ARs, and ridging over the western United States. Her talk emphasized that research efforts to better understand S2S predictability of these phenomena is a necessary, but not sufficient, component of DWR-funded S2S work. The main emphasis from a water manager’s perspective is to obtain a useful S2S forecast tool or operational S2S product that can aid in decision support.

Dr. Mike DeFlorio, the lead researcher on S2S at CW3E, spoke in the next presentation about the joint CW3E/JPL efforts over the last year to: a) conduct fundamental research to improve understanding of S2S predictability of precipitation, ARs, and ridging, and b) to produce (or refine existing) experimental S2S forecast products that can aid in decision support for western water applications. His work highlighted both his own research/experimental product development, and the research/product development led by other CW3E/JPL S2S team members. Dr. DeFlorio also highlighted CW3E/JPL’s involvement in the S2S Prediction Project’s Real-time Pilot Initiative, which is a joint Research-to-Operations (R2O) initiative by the World Weather Research Programme (WWRP) and World Climate Research Programme (WCRP) to promote the uptake of S2S forecasts to support users and decision-makers. CW3E/JPL is the only team participating in this global initiative with a water management-related end user representative (California DWR).

The next talk was given by Dr. Sasha Gershunov (CW3E/Scripps), who presented CW3E’s experimental seasonal forecast for precipitation over the western U.S. during the January-February-March period. This work is based on research described in Gershunov and Cayan (2003) and leverages canonical correlation analysis of sea surface temperature (SST) and precipitation over the Pacific/western U.S. region. In addition to presenting this experimental seasonal forecast, Dr. Gershunov also focused on the research that was a necessary condition for providing a potentially useful forecast [Gershunov and Cayan 2003]. Accordingly, he presented a hindcast skill assessment of the statistical model that was used to make the experimental seasonal prediction for this winter.

The first day of the workshop concluded with a talk by Dr. Michael Anderson, the state climatologist at California DWR. His presentation focused on examples of ways that DWR can potentially utilize subseasonal (weeks 3-5 lead time) to seasonal (monthly lead time) forecasts of precipitation, ARs, and ridging over the Western U.S. region.

The second day of the workshop began with a presentation from Dr. David DeWitt, the Director of NOAA’s Climate Prediction Center (CPC). His talk emphasized the various S2S efforts ongoing at CPC, and in particular focused on the importance of the passage of the Weather Act in 2017 (and its reauthorization in 2019), which specifically includes S2S forecasts as a target area for improvement. Dr. Matt Switanek then gave a presentation on the efforts of he and his team at NOAA ESRL to improve statistical S2S forecasts of precipitation over the western U.S. The morning of Day 2 continued with a talk by Dr. Peter Gibson (NASA JPL/CalTech) on experimental subseasonal ridging outlooks that he and Dr. Duane Waliser (NASA JPL/CalTech) have led the development of. These experimental outlooks are supported by several research efforts that Dr. Gibson has led, which all seek to better understand the types of ridges that impact the western U.S., along with providing a subseasonal skill assessment of several dynamical hindcast systems in predicting these ridge types. The last talk of the morning of Day 2 was given by Dr. Rong Fu (UCLA), who presented an experimental seasonal prediction of precipitation over the western U.S. using a similar CCA-based methodology of that employed by the Scripps seasonal forecasting team.

The afternoon of day 2 concluded with several talks by: CW3E Deputy Director Dr. Luca Delle Monache on opportunities for applying machine learning techniques to improve S2S prediction; a joint talk by Dr. Duane Waliser (NASA JPL/CalTech) / Dr. Andy Robertson (IRI) / Dr. Xubin Zeng (University of Arizona) on upcoming work to improve S2S prediction of snowpack over the western U.S.; and a discussion led by Jeanine Jones on potential ways to increase the scope of ocean observations to improve S2S prediction. CW3E Field Research Manager Dr. Anna Wilson, Dr. Bruce Cornuelle (Scripps), Dr. Luca Centurioni (Scripps), and CW3E Deputy Director Dr. Luca Delle Monache also participated in this discussion as panel members.

The final day of the 11th Annual WOW meeting began with a talk by Scripps postdoctoral research Dr. Dillon Amaya, who presented an overview of “Blob 2.0”, a near-record pattern of warm SST anomalies over the North Pacific that emerged during Summer 2019. His talk focused on the extent to which Blob-like warm anomalies could be a source of S2S predictability for drought over the western U.S. region. Dr. Jon Rutz (NWS Western Region) then gave a presentation which provided an overview of research-to-operations in NWS. The final talk of the workshop was given by Jeanine Jones (DWR), which focused on the Colorado River basin and highlighted ways in which improved S2S forecasts of precipitation would benefit stakeholders and end users in this region. The workshop concluded with a roundtable discussion involving all workshop attendees. Each WOW participant provided their general thoughts on the workshop, and identified various pathways going forward to better facilitate efficient S2S R2O efforts for California DWR.