Snowmelt causes different limitations on transpiration in a Sierra Nevada conifer forest
July 9, 2020
CW3E field researcher Ava Cooper, along with her Master’s advisor and CW3E collaborator, Adrian Harpold and their University of Nevada, Reno (Ben Sullivan and Scott Tyler), National Center for Atmospheric Research (Danica Lombadozzi), and ETH Zürich (James Krichner and Sebastian Wolf) collaborators published a paper in Agricultural and Forest Meteorology titled “Snowmelt causes different limitations on transpiration in a Sierra Nevada conifer forest”. This article summarizes Ava’s work for her hydrology Master’s at the University of Nevada, Reno where she studied sap flow in trees (a proxy for transpiration) in relation to snow. While this work was not done at CW3E, the results can inform the monitoring and projections of climate variability and change priority of the CW3E strategic plan as a baseline for impacts of snow on ecohydrology to compare to future changes in snow.
Snowmelt is a major source for summer soil water storage that supports tree growth in the Mediterranean climate of the Sierra Nevada, California. The timing and magnitude of snow-water contributions to soil moisture are controlled by energy and water availability that varies based on climate (and thus weather) and topography (i.e. elevation, slope, and aspect). Few studies, thus far, have explored how transpiration rate is affected by differences in the timing and magnitude of snowmelt across years and locations. Here we used meteorological and hydrological measurements on north and south aspects in the Sagehen Creek catchment (Sierra Nevada, California) to investigate the controls on the timing of conifer sap flow, a proxy for transpiration rate, in response to the timing and magnitude of snowmelt.
We found that sap flow prior to its seasonal peak in July was largely controlled by air temperature and that spring sap flow was reduced by cloudy conditions. Years with earlier snow disappearance caused earlier peak sap flow, which was nearly coincident with the beginning of soil moisture limitations, than years with later snow disappearance. Because Sagehen Creek receives little summer rainfall, years with earlier snowmelt and peak sap flow had more total days with soil moisture limitation on sap flow. Overall, our results suggest that earlier snow disappearance and more spring rain (both expected to result from climate change) will potentially shift the peak of sap flow earlier in the growing season and increase the duration of water limitations during summer. These insights about the timing and duration of water limitations could be used as benchmarks to test physically based models and better constrain predictions of transpiration rates in snow-dominated landscapes similar to the study site.
Figure 1. Map of Sagehen Creek watershed and its location in California. On the watershed map, shades of green show forest cover (0% forest cover in white to 100% forest cover in green) and the red area marks the site used in this study.
Figure 2. Daily average sap flux density (yellow=south, teal=north). The shaded regions show the 90% confidence interval for sap flux density. The heatmaps show the environmental factor most limiting to sap flow for each day (red = air temperature, orange = vapor pressure deficit, yellow = incoming solar radiation, blue = soil moisture). Peak snow water equivalent (SWE) is marked by a triangle and snow disappearance is marked by a circle for each site and year. Data are shown for 2016 (top set), 2017 (middle set), and 2018 (bottom set).
Cooper, A. E., J.W. Kirchner, S. Wolf, D.L. Lombardozzi, B.W. Sullivan, S.W. Tyler, A.A. Harpold, 2020: TSnowmelt causes different limitations on transpiration in a Sierra Nevada conifer forest. Agricultural and Forest Meteorology, 291, https://doi.org/10.1016/j.agrformet.2020.108089
CW3E Hosts Virtual Atmospheric River Reconnaissance Workshop
July 8, 2020
The first official Atmospheric River Reconnaissance (AR Recon) Workshop was planned to be held at Scripps Institution of Oceanography from June 29 – July 1, 2020. Due to the pandemic, the workshop was instead held virtually from 8-11 am Pacific Time each morning June 29 – July 1.
The purpose of the AR Recon Workshop was to document impacts and envision AR Recon out to 2025. The goals were to share results, to coordinate and inspire future work on data collection, data assimilation, metric development and impact assessment, and to discuss the research and operations partnership approach being developed in AR Recon. The workshop was organized by the AR Recon Modeling and Data Assimilation Steering Committee. Workshop co-chairs were CW3E Director Marty Ralph, Chief of the Modeling and Data Assimilation Branch of the Environmental Modeling Center at NCEP Vijay Tallapragada, and Naval Research Laboratory Senior Scientist Jim Doyle. The workshop brought together over 60 attendees from leading academic institutions and US and international agencies to focus on AR Recon and improvements in AR prediction. In addition, the workshop provided an opportunity for early career researchers to participate in developing a road map for future AR Recon efforts.
The meeting began with opening remarks from workshop co-chairs. The first day’s schedule focused on the Research and Operations Partnership and included background presentations on the relationship between atmospheric rivers and extratropical cyclogenesis along with perspectives from partners in the Air Force and NOAA Aircraft Operations Center. There were also presentations on data collection and impact assessments from GPS Airborne Radio Occultation, and Global Drifter Program buoys deployed as part of AR Recon.
The second day was focused on results of studies looking at the impacts of AR Recon dropsondes on forecasts. Exciting results were shared by all modeling centers partnering in the AR Recon Modeling and Data Assimilation Steering Committee, including CW3E, NCEP, ECMWF, NRL, and NCAR. One outcome was the decision to coordinate on a group of cases to study in more detail.
The third day of the workshop consisted of facilitated discussions on topics including collaborations with European colleagues to develop AR Recon in the Atlantic, leveraging plans for the North Atlantic Waveguide, Dry Intrusion, and Downstream Impact Campaign (NAWDIC) effort (a follow-on campaign to NAWDEX); sampling strategies thus far and in future; and the National Winter Season Operations Plan. Excellent progress was made during these discussions and follow up activities are planned on all topics.
Throughout, the workshop was very collaborative and featured lots of lively and in depth discussion between the participants. Future events will be planned for the fall ahead of the next AR Recon season.
This workshop integrates several of the CW3E priorities from the 5 year strategic plan including Atmospheric Rivers Research and Applications, Emerging technologies and Modeling capabilities for the Western US.
AR Recon Workshop participants (unfortunately, only 25 cameras are allowed on at once) before adjourning the virtual meeting on July 1, 2020.
Measuring and Managing Seasonal Variability: CW3E Explores the Yampa River Basin
July 7, 2020
The Yampa River is one of the wildest remaining major tributaries of the Colorado River and supports a rich ecosystem, local agriculture and ranching, and a robust recreation industry. It also provides crucial water supplies to local stakeholders and locations as far removed as Arizona and Southern California. A multitude of environmental and societal factors are expected to be affected by climate change in the Yampa River Basin, and are pertinent to other watersheds around the American West.
This year, due to the pandemic, CW3E was unable to travel in person to Steamboat Springs, Colorado, for the third Yampa Basin Rendezvous (YBR). Instead, we restructured and are offering these important events virtually! YBR is a community-oriented event organized by CW3E and partners from Colorado Mountain College, Yampa Valley Sustainability Council, Friends of the Yampa, Steamboat Resorts, and Vacasa. During the event, which built off the inaugural Rendezvous held in 2018 and the second Rendezvous held in 2019, participants are examining the Yampa River Basin through the lens of climate change and seasonal variability. Panels began in June and will continue through the fall in an interactive webinar format. The webinars include talks by regional experts and lively discussions. During the first webinar, held on June 4, 2020, we introduced the series and provided an overview of the past year in the Yampa Basin with an eye to this year’s theme of Seasonal Variability. Our panelists included Marty Ralph, Director of the Center for Western Weather and Water Extremes (CW3E), Kent Vertrees, with Friends of the Yampa and Steamboat Powdercats, and Nathan Stewart, Associate Professor of Sustainability Studies at Colorado Mountain College. Carrie Hauser, President, and CEO of CMC, kicked off the online event. There were 102 registered participants for the webinar, which can be viewed here.
The second webinar is coming up this week! It will be a panel discussion on Changes in Measurement with a Changing Climate, held on July 9, 2020 from 11-12:30 Mountain Time. This webinar will address what our measurement data is showing us and ways we can adapt our strategies to be more effective. Sometimes, the tools we use to measure seasonal change aren’t giving us the same predictive information as they have in the past, so adapting our techniques and developing new technologies is key. Our panelists will include Mike Dettinger, Visiting Researcher at Scripps Institution of Oceanography; Jeff Deems, Research Scientist with National Snow and Ice Data Center; and Gannet Hallar, Associate Professor of Atmospheric Science at University of Utah. Register here!
This dialogue with the local community allowed pairing of research interests of graduate students, post-doctoral scholars, researchers, staff and faculty from CW3E and other universities with the community’s experts and decision makers. This effort is meant to help understand the risks posed by warming temperatures and rising snowlines, and how we are currently measuring the existing seasonal variability and adapting to manage the impacts of current and expected seasonal changes in the Colorado River Basin and California. These events also strengthen connections between those who live in the Yampa basin and some of those who depend on its water.
The first webinar of Yampa Basin Rendezvous 2020 was held on 4 June, 2020.
Congratulations to Dr. Fish – CW3E Graduate Student Successfully Defends Dissertation
June 25, 2020
The fourth CW3E PhD student has successfully defended her dissertation. Dr. Meredith Fish’s defense was held on Wednesday, June 24, 2020. Her dissertation title is “Identification and Multi-scale Analysis of Successive Atmospheric River Events in California” and includes one chapter published in a peer-review journal (Fish et al., 2019). Her second chapter is in review at Journal of Climate, and her last two chapters will be submitted to Journal of Climate and/or Monthly Weather Review. Meredith’s committee members were Marty Ralph and Art Miller (Co-Chairs), Ian Eisenman, Sarah Gille, Joshua Graff Zivin, and Shang-Ping Xie. Funding for Meredith’s dissertation came from FIRO and the AR Program, both under PI Marty Ralph.
Meredith has been selected to be a Postdoctoral Scholar working with Robert Kopp at the Climate Impact Lab at Rutgers University in New Brunswick, NJ.
Due to the COVID-19 health crisis, Meredith defended her dissertation virtually. CW3E is incredibly proud of Meredith’s accomplishment, and looks forward to honoring her with an in-person celebration as soon as the health precautions are no longer necessary.
Meredith Fish being introduced by her Committee Co-Chair Art Miller before her dissertation defense via Zoom.
Meredith Fish introducing the concept of cyclone families in relation to successive atmospheric river events.
Fish, M.A., A.M. Wilson, and F.M. Ralph, 2019: Atmospheric River Families: Definition and Associated Synoptic Conditions. J. Hydrometeor., 20, 2091-2108, https://doi.org/10.1175/JHM-D-18-0217.1
CW3E Graduate Student Awarded the UC President’s Dissertation Year Fellowship
June 24, 2020
CW3E Graduate Student Tashiana Osborne was recently awarded the UC President’s Dissertation Year Fellowship. This is a competitive fellowship awarded to promising students in the final stages of their doctoral work who demonstrate strong potential for university teaching and research. Tashiana’s dissertation research defines, detects, and characterizes extreme intra-storm changes in the partitioning of rain and snow across California, and associated hydrologic impacts. Many of these cool season storms are linked to atmospheric rivers which form above tropical Pacific Ocean regions. Upon reaching land and interacting with topography, precipitating storms may provide beneficial water, but can also alter atmospheric conditions. Swift, significant changes can present challenges for forecasting and introduce flood, ice, or snow hazards. Tashiana aligns objectives with UN Sustainable Development Goals designed as blueprints for achieving a safer, more sustainable and equitable future.
Five students received the UC President’s Dissertation Year Fellowship this year, and Tashiana was the only recipient from Scripps Institution of Oceanography. CW3E is very proud to share Tashiana’s latest achievement.
Negin Hayatbini joined CW3E as a Data Science Postdoctoral Researcher in May 2020. She earned her Ph.D. in early 2020 from the University of California, Irvine, Department of Civil and Environmental Engineering under the supervision of Distinguished Prof. Soroosh Sorooshain and Prof. Kuolin Hsu.
Her Ph.D. research was focused primarily on the application of Deep Learning and Computer Vision techniques to improve and develop state-of-the-art precipitation estimation and forecast algorithms. She leveraged the big-data available from recent developments in satellite technologies, along with advancements in Machine Learning (ML) algorithms and computational power, to develop analytical and data-driven tools for precipitation characterization. For her doctoral dissertation she developed an effective cloud segmentation and tracking algorithm and designed a feature extractor to train a Neural Network for more accurate quantitative precipitation estimation from multiple sources of information.
In the course of her Ph.D., Negin was awarded a graduate research fellowship at NASA Jet Propulsion Laboratory (JPL) and she has also spent some time at Bay Area Environmental Research Institute/NASA Ames as an intern working on the development of advanced Deep Learning frameworks for near-real-time precipitation retrieval from multispectral satellite imagery.
At CW3E, Negin will focus on designing novel approaches based on Machine Learning algorithms to improve the prediction of extreme weather and water events, with the potential to significantly benefit operations of water reservoirs in California and Western States. Her work will assist the acceleration of efforts in Forecast Informed Reservoir Operations (FIRO) and the AR Program.
CW3E Assists in Hosting Virtual Post-Fire Science Symposium
June 11, 2020
On May 19-20, CW3E, in collaboration with several federal entities and non-governmental organizations, organized and hosted a virtual post-fire science symposium as part of an ongoing workshop series called After the Flames (Fig 1). Though there are numerous considerations post-fire, the primary discussions during this conference related to hazards such as flash floods and debris flows on burn areas. Debris flows are one of the main focus areas in the California Department of Water Resources Atmospheric River Program at CW3E; researchers are working towards improved understanding and forecasting of short-duration, high-intensity rainfall capable of triggering flash floods and debris flows on recently burned areas.
Figure 1. Introductory slide for meeting with organizer names and affiliations.
This virtual symposium evolved out of a session that was to be part of a multi-day conference scheduled in early April but canceled due to COVID-19. The organizers recognized a need in the post-fire community to take time to connect, share ideas, and discuss pathways forward, especially in the midst of a global pandemic and preceding the onset of the western US wildfire season.
The goals of the workshop were to:
Assess post-fire science needs and barriers to communication of science
Determine effective communication strategies for post-fire science
Develop pathways forward for working together in post-fire response
The workshop targeted both researchers and practitioners of post-fire science. Though there are numerous considerations post-fire, the primary discussions during this conference related to hazards such as flash floods and debris flows on burn areas. At the height of attendance, approximately 250 people were tuned in. Attendees consisted primarily of researchers and practitioners at federal agencies (53%). The next largest representation was state agencies (14%), followed by NGOs (10%) and university/education (10%); Fig 2.
Figure 2. Attendee sector based on 173 responses using Mentimeter polling software.
Day 1 of the workshop featured an introductory presentation on advancements in post-fire science by Jeremy Lancaster at the California Geological Survey. This was followed by a panel discussion in which seven practitioners shared their science needs and suggestions for moving forward. Day 1 wrapped up with polling the audience on various aspects of science needs using Mentimeter, an interactive polling software. With a large number of attendees, it was not feasible to have participation as in an in-person conference (e.g., asking questions, breakout groups). The Mentimeter software allowed for audience feedback and participation in the absence of verbal communication.
Figure 3. Nina Oakley (CW3E), Pete Robichaud (US Forest Service), and Jason Kean (USGS) comment on emerging poll results during Day 2’s polling session.
Day 2 of the workshop focused on science research and pathways for moving forward in post-fire response. The day began with a panel of research scientists in post-fire hydrology, meteorology, and social science who discussed the current cutting edge in their fields, opportunities and limitations to scientific progress, and communication efforts. This was followed by a Mentimeter polling exercise on future research avenues and barriers to use of research by practitioners. The day continued with a presentation by Troy Timmons (Western Governors’ Association) and Mike Zupko (Wildland Fire Leadership Council) on initiatives for post-fire response from their organization. Lastly, Anne Bradley (The Nature Conservancy) and Cara Farr (US Forest Service) discussed other networks and collaborative efforts addressing post-fire issues.
Figure 4. Audience responses to the above question in Mentimeter poll. There were 126 responses and attendees could choose multiple options.
Some of the preliminary insights and takeaways from the conference:
There is great interest in post-fire issues and a desire for similar conferences to keep the conversation going (perhaps covering additional post-fire topics such as water quality, soils, revegetation).
There is a need for improved precipitation monitoring, especially in areas of poor radar coverage in the West, as well as improved precipitation forecasts. Sub-hourly timescales are the most critical to consider for post-fire debris flow hazards.
Time for interpretation and application of scientific research was noted as the greatest barrier to use of science. This could potentially be resolved through novel methods of communicating science including webinars, podcasts, or newsletters (Fig 4).
Communication related to post-fire issues (specifically between whom is unclear) stands out as one of the greatest post-fire challenges (Fig 5).
Coordination across agencies in post-fire response is also cited as a major challenge.
Assessment and communication of uncertainty around post-fire hazards is a strongly recommended research focus area.
Downstream impacts, runout, and inundation associated with post-fire flash floods and debris flows as well as post-fire water quality issues were also noted as recommended research focus areas.
Climate change and its effects on vegetation and fire characteristics as well as rainfall intensity is also a recommended research focus area.
A full report summarizing the conference, findings from polling activities and next steps is forthcoming. One of the priority areas in CW3E’s Strategic Plan is Atmospheric River Research and Applications, which includes the production of decision support tools that meet the needs of western US forecasters, resource managers, and emergency managers. Post-fire debris flows in Southern California often occur during atmospheric river conditions (though triggered by finer scale convective features within the atmospheric river system; Oakley et al. 2017). Participating in this conference gave CW3E researchers an opportunity to hear the perspectives of practitioners managing post-fire debris flow hazards. This information subsequently influences research priorities and characteristics of information produced and tools developed. Additionally, valuable connections were built between CW3E and co-hosting agencies and participants that will facilitate future collaborations in addressing post-fire debris flow hazards.
Figure 5. Word cloud featuring responses to the prompt: What three words or phrases describe your post-fire challenges? Larger word size indicates a greater frequency of the word in responses. This word cloud incorporates 111 attendee responses and has been post-processed to combine similar words.
Nina Oakley’s participation in this conference was supported by the NOAA/NWS CSTAR Program and the California Department of Water Resources Atmospheric River Program.
Characteristics and Impacts of the April 4-11 2020 Cutoff Low Storm in California
June 3, 2020
Nina Oakley, Marian de Orla-Barile, Ben Hatchett (Desert Research Institute), Paul Burgess (CA Geological Survey), Marty Ralph
Main points:
Cutoff lows can generate significant springtime precipitation, as evidenced in the April 4-11 2020 event that bolstered water resources throughout California and caused damaging landslides in San Diego County.
Cutoff lows commonly produce unusual weather patterns and out-of-season precipitation and are notoriously challenging to forecast.
Improved understanding of cutoff low characteristics and forecast challenges will support water resource and emergency management.
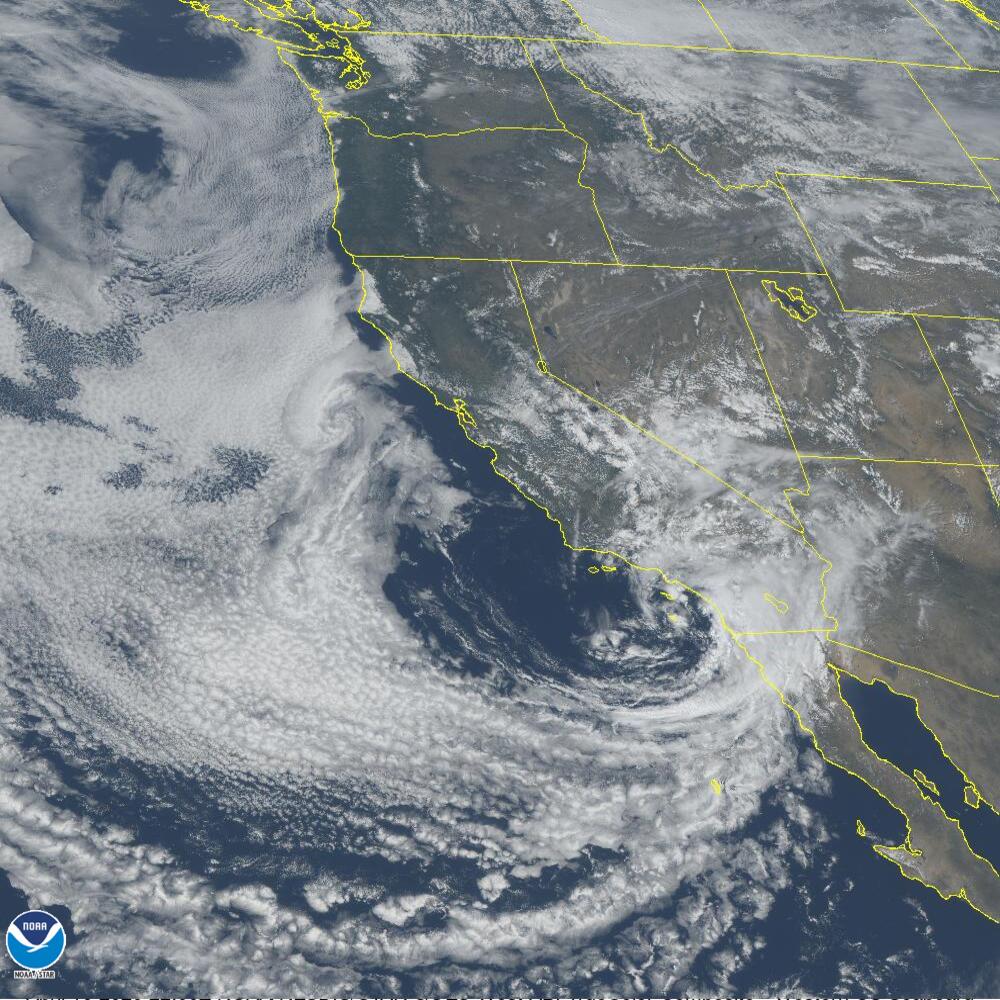
Figure 1: GOES-West TrueColor image showing the cutoff low over Southern California at 22:00 UTC on April 10 2020. Source: NOAA NESDIS STAR
A large cutoff low-pressure system impacted California from April 4 through April 11 (Fig 1).
Cutoff low-pressure systems are so called because they are “cut off” from the mean westerly flow (or “jet stream”). This allows them to persist over an area for an extended period of time, which may result in unusual weather patterns and often persistent precipitation. These features are a typical springtime phenomenon in the western US (see here and here) as the jet stream retracts poleward. Precipitation totals and impacts from cutoff lows vary greatly from year to year. For example, Oakley and Redmond (2014) found that anywhere from 15-80% of October-May precipitation in Los Angeles was associated with cutoff lows with no clear temporal trend over the period of 1948-2010.
Following well-below normal winter precipitation totals, this late-season storm produced beneficial Sierra Nevada snowfall as well as record-breaking rainfall in Southern California, bolstering water resources throughout the state. In Southern California, this precipitation suppressed fire weather and drought concerns, but also caused numerous damaging landslides in northern San Diego County. Here, we describe some of the unique characteristics of this storm, its impacts, and pathways forward for studying and forecasting cutoff low storms.
Figure 2: April precipitation was near to slightly above normal in central California and the Sierra Nevada and 200-800% of normal across much of Southern California. Nearly all precipitation in this area was associated with the April 4-11 storm. April precipitation was generally below normal elsewhere in the West. Source: HPRCC
Figure 3: Synoptic map for 0000 UTC April 4 – 2300 UTC 11 April 2020 with integrated water vapor transport (kg m-1 s-1, filled contours), 300 hPa winds (barbs), and 500 hPa heights (decameters, red contours). Data source: ERA5
The cutoff low approached the California coast on April 4th and began making its way down the California coast by the 5th. Precipitation began in coastal California and the Sierra Nevada by April 4th. The cutoff low was initially accompanied by a weak atmospheric river (ranking as 1 on the AR Scale; IVT of 250-400 kg/m/s) along its southeastern flank. The cutoff low system ushered in cold air; daily average temperatures dropped more than 10°F (5.5°C) below normal at many Sierra Nevada locations during the event. The snow level (elevation above which rain transitions to snow) during the event hovered around 5000-6000 ft in the Sierra Nevada, allowing much of the mountain precipitation to fall as snow. In the Transverse Ranges of southern California, snow levels ranged from 6000 to 7000 ft.
The AR/cutoff low combination began to produce precipitation over Southern California on April 6. By April 7, the center of the cutoff was offshore of Pt. Conception with a weakening plume of moisture remaining over San Diego County. A period of enhanced moisture transport occurred towards the end of the day on April 7 as a weak embedded disturbance moved through the cutoff low. This produced an additional period of moderate to heavy precipitation in San Diego County from April 7th into the 8th.
Figure 4: HYSPLIT model back trajectory for a point in San Diego County shows transport occurring from the Mojave and Sonoran Desert regions, over the Sierra Nevada and Coast Ranges, flowing offshore, and back into San Diego County in a cyclonic (counter-clockwise) manner. This transport of moisture supported persistent precipitation in Southern California, and the elevated nature of this transport is consistent with the deep saturated layer observed in the latter part of this storm (see Fig 5). Trajectory created with HYSPLIT
The cutoff low began to move east during the latter part of the 8th and was centered over the southern California/Nevada border by the 9th. During this time, a transition from widespread precipitation to scattered showers and thunderstorms occurred over San Diego County and surrounding areas as the atmospheric river weakened and moved southeast. The cutoff low system then began to retrograde westward, with the center meandering west and becoming situated over southern California again late on the 9th. Winds wrapped around the cutoff low, transporting moisture from the Mojave and Sonoran Desert regions in a counter-clockwise fashion. This configuration supported moisture transport over the Sierra Nevada and Coast Ranges, offshore, and back into southern California (Fig 4). The most prominent moisture pathway was through the characteristically lower terrain of the northern Sierra Nevada and San Francisco Bay Area terrain gaps. Under typical conditions of westerly flow, these areas are common corridors for eastward-traveling atmospheric river moisture to reach the Sierra Nevada and further inland. This “roundabout” moisture transport supported a period of upslope flow and precipitation along the eastern slopes of the Sierra Nevada as well as another period of widespread precipitation for coastal Southern California on April 9th and 10th. As the upper level cutoff center moved south and became situated over the Southern California Bight late on the 10th, the associated moisture plume weakened and moved into northern Baja. Widespread showers gave way to light showers and localized thunderstorms. The system exited to the east on the 11th with showers tapering off in Southern California.
Figure 5: Atmospheric soundings from San Diego (left) at 00 UTC April 7 2020, under atmospheric river conditions and (right) at 00 UTC April 11 2020 under cutoff low conditions. Note tropopause height is much lower (~350 mb) under cutoff low conditions (right) as compared to AR conditions (~225 mb, left); a depressed tropopause is a well-known characteristic of cutoff lows. The amount of integrated water vapor (IWV) is similar in both cases, though the near-saturated to saturated layer is much more shallow under AR conditions (below ~750 mb, left) and much deeper (below ~450 mb, right) in the cutoff low scenario, associated with long-range upper-level moisture transport described in Fig 2 and 3. Source: U. Wyoming
Precipitation Impacts in Northern California and the Sierra Nevada
Figure 6: Change in Sierra Nevada snow water equivalent (SWE) in mm, April 11 2020 minus April 4 2020. A change of 50 mm corresponds to approximately 2 inches of SWE. Panel a) depicts the Sierra Nevada, panels b) and c) zoom in on the Yuba and Feather River watersheds and the Tuolumne watershed, respectively. Watershed boundaries are shown in red. Data source: SNODAS
In northern California, the precipitation associated with this event was not outstanding, but produced a modest late-season precipitation and snowpack increase in an otherwise drier than normal year. Most Sierra Nevada locations received 2-5 inches (50-125 mm) of liquid precipitation over the course of the storm. This was the only significant precipitation event of the month and brought monthly totals near to slightly above normal (Fig 2). The below normal temperatures and moderately low snow levels (~5000-6000 ft; characteristic of a typical winter storm) produced beneficial snowfall over a large area of the Sierra Nevada. Simulated snow water equivalent increased by up to 150 mm (6 in) from this event (Fig 6), with the greatest increases occurring in the central and southern Sierra Nevada. This event produced a 7-14% increase in percent of April 1 average snowpack across the state (Fig 7).
The precipitation totals and snowpack increases associated with this storm were not outstanding compared to a substantial winter storm, though the timing and context in the water year are noteworthy. On April 1, statewide SWE was reported as 54% of normal, brewing concern among water resource managers. This storm raised statewide average snowpack to 65% of average for April 11, with an increase of 10% in the northern Sierra, 12% in the central Sierra, and 16% in the southern Sierra (Fig 7). While it did not erase water resource concerns for the Water Year 2020, it provided a welcome late season addition to the otherwise well-below average snowpack.
Figure 7: Percent of April 1 average and percent of normal for date in three regions of California for April 4, prior to storm (left), and April 11, following storm (right). Source: California Department of Water Resources/CDEC.
CW3E’s northern California focus watersheds are the Russian River, the Yuba and Feather Rivers, and the Tuolumne River. This storm did not favor the Russian River Basin; most stations in the region received less than 1 inch of precipitation and reported April precipitation totals below 50% of normal. In the Yuba and Feather basins, precipitation totals were near to slightly above normal. Quincy recorded 2.43 inches for the storm and 88% of normal for the month. Portola observed 1.47 inches for the storm and 127% of normal for the month. Strawberry Valley observed 5.20 inches, 82% of normal for April. Further south on the Tuolumne River, Hetch Hetchy reported 2.76 inches for the storm and 3.34 inches for the month, which was 101% of normal for April. As much of the precipitation fell as snow above 5000 ft, there was not a pronounced increase in flow on either the Yuba, Feather, or Tuolumne Rivers. In all three watersheds, runoff associated with the storm did not stand out substantially from the seasonal snowmelt signal of the rising limb of the spring hydrograph.
Precipitation Impacts in Southern California and San Diego County
Precipitation totals and impacts were much more anomalous in Southern California, with totals over the 7-day period from April 5-11 in excess of 5-7 inches at some coastal locations (Fig 8). The northern part of San Diego County observed particularly notable precipitation totals. Miramar NAS recorded 5.07 inches for the month, its wettest April on record (1947-present), crushing the previous record of 3.84 inches set in 1965. Normal April rainfall at this location is 0.81 inches. Palomar Airport recorded 6.41 inches, the wettest April in its relatively short record (1998-present) and more than half of its typical annual precipitation (11.84 inches). A unique characteristic of this event was the persistence of the cutoff low over the area for multiple days and the transport of moisture from various locations throughout its duration, producing precipitation over a seven-day period. In contrast, a progressive (eastward moving) disturbance embedded in the jet stream typically produces only a few days of rainfall.
Figure 8: Event accumulated precipitation (top) and 15-minute precipitation depth (bottom) for six San Diego County ALERT network gauges. Gauge locations are shown in Fig 8. The vertical grey bar indicates the maximum 15-minute intensities in northern San Diego County and the presumed time of greatest landslide occurrence. Source: San Diego County Flood Control District
Precipitation from this multi-day event increased soil moisture in much of San Diego County. Towards the end of the event, an isolated thunderstorm produced 0.67 inches of precipitation in 15 minutes near Encinitas (Fig 8, 9) late in the afternoon on April 10 (23:50 UTC 10th). This corresponds to a 500-year precipitation event according to NOAA Atlas 14. Numerous field-verified landslides were reported in this area (Fig 10), including one large shallow landslide that mobilized as a debris flow between 5 and 6 pm PDT on April 10, according to eyewitnesses, and at the same time the highest intensity rainfall observations occurred in Encinitas (Fig 8). This landslide and debris flow caused at least $300K worth of damage to the San Dieguito Tennis Club in Encinitas. The reported landslides were confined to the area of this intense thunderstorm (Fig 9), suggesting that the combination of the antecedent rainfall and the burst of high-intensity rainfall were both important components needed to produce the concentrated impacts observed throughout the Encinitas and Solana Beach communities (Fig 8, 9).
Figure 9: Maps showing radar reflectivity at 23:47 UTC (16:47 PDT) and location of gauges used in Fig 7 (circles) and reported landslides (triangles). Map on right zooms in to show detail in the black box in map on left. Landslide locations from California Geological Survey Landslide Inventory. Radar data from NOAA Weather and Climate Toolkit.
Figure 10: (a) A shallow landslide that mobilized into a debris flow was observed the evening of April 10 at the San Dieguito Tennis Club in Encinitas, and (b) a shallow landslide observed at a home in Solana Beach. Both are presumed to have occurred following high intensity rainfall (Fig 9) on an area that had received several inches of rain over the prior days (Fig 8). Image (a) courtesy of San Dieguito Tennis Club and image (b) courtesy Douglas Alden, UCSD/SIO.
One of CW3E’s southern California focus areas is the Santa Ana River Basin. During this event, stations within the Santa Ana River watershed received anywhere from 250% to more than 400% of normal April monthly precipitation. This precipitation produced beneficial runoff into the Santa Ana River, supporting Orange County Water District’s groundwater recharge efforts. The maximum daily discharge for this event for the USGS gage Santa Ana River at MWD Crossing (above Prado Dam, Fig 11) was 943 cfs, the 7th highest April daily discharge since records began in 1970, and exceeds the 99th percentile daily discharge for April.
What next? Forecast challenges and other concerns raised by this event
Figure 11: Hydrograph of Water Year 2020 through late May on the Santa Ana River at MWD Crossing (above Prado Dam). This location is upstream of the Orange County Water District recharge projects. Source: USGS
In portions of the Yuba and Feather River basins, precipitation forecasts issued three days in advance were more than 1 inch below observed values for the 24-hour period ending April 5. This corresponded to precipitation observations at some locations being more than 200% of forecast amounts (Fig 12, left). In San Diego County, the differences between forecast and observed were more profound. In the Encinitas area in the coastal northern part of the county, at a three-day lead time, forecast precipitation for a 24-hour period ending April 11 was roughly 0.25 to 0.35 inches. The observed precipitation estimates are in excess of 2.5 inches. This represents an under-forecast of 2.25 inches, or ~90% (Fig 12, right). Even at a one-day lead time (not shown), precipitation estimates for northern San Diego County were still 1-2 inches below observed. This event showcases the challenge of accurately predicting precipitation associated with a cutoff low even at relatively short (1-3 day) lead times.
Figure 12: Left: Difference in precipitation forecast at a three-day lead and estimated observed precipitation for Northern California for a 24-hour period ending at 4 am PST April 5. Right: Difference in precipitation forecast at a three-day lead and estimated observed precipitation for a portion of Southern California for a 24-hour period ending at 4 am PST April 11. Data and image source: CNFRC
This persistent April cutoff low event produced late season snowfall and sustained precipitation in California, tempering water resource concerns in a well-below normal precipitation year. This event attests to the fact that, in an otherwise dry year, there is a possibility for significant spring rainfall through events with climatologically anomalous characteristics. The trajectories of cutoff lows and their associated precipitation are not will simulated by operational weather forecast models or sufficiently represented in seasonal-to-subseasonal forecasting. They are also not well-resolved in climate projections. This is due to several factors: 1) their detachment from the mean westerly flow and ability to meander and persist for multiple days; 2) their capacity to transport moisture in unusual patterns; and 3) their likelihood of triggering convection (thunderstorms) and intense rainfall by bringing in cold air aloft that destabilizes the atmosphere.
Cutoff lows, with or without atmospheric rivers, have a notable influence on springtime precipitation in California. They can slow the start of the wildfire season, extend the ski season, and contribute to spring wildflower blooms. By focusing efforts on understanding the range of characteristics and impacts of cutoff lows, we can improve forecasts to support water resource and emergency management.
Chollas Creek Community Science Trash-Tography Project
June 2, 2020
CW3E Field Researcher, Carly Ellis, and her AGU Thriving Earth Exchange team recently grappled with how to wrap up a monitor trash in Chollas Creek in a fun and safe way. The project has leveraged a California State Water Resources Control Board Surface Water Ambient Monitoring Program (SWAMP) Rapid Trash Assessment and modified it to be accessible to elementary school students. They have also incorporated the use of photography, so that assessments can be carried out in areas that might not be accessible or safe for students. The class has met with their team of mentors on a monthly basis to build the project from the ground up, even coming up with a catchy project name: Trash-tography.
The original goal of this project was to engage students in community science and inspire them to become environmental stewards of their own community while teaching them about the scientific process. The project was going to culminate with the students presenting their results and photographs to friends, parents, teachers, and local officials in hopes of inciting clean-up events and changes in legislation. However, due to general health concerns about public gatherings, the project’s public facing component needed to be adjusted.
Throughout the duration of the project, and especially during meetings and field trips where students played a pivotal role, the methodology of the Chollas Creek trash monitoring program underwent numerous iterations. Changes ranged from as minor as how to break up the stream sections among survey groups to as major as switching from paper surveys to Google Forms accessible on iPads. Along the way, the students were experts at troubleshooting on the iPads and coming up with solutions for how best to simultaneously view stream photographs and answer survey questions. They were thrilled when they realized they could use data they collected with the math functions they had just learned in another class and were equally excited when it came to visualizing their data as colorful pie charts and bar graphs. The students even began holding each other accountable in the field, making sure no classmates were losing pencils or leaving anything behind that may be bad for their watershed.
The team of young scientists from Carver Elementary guided their adult mentors to a final trash assessment program that is robust and reproducible. This methodology became the focus of the project’s final product. With the help of Public Lab, a collaborative non-profit organization, the Chollas Creek team was able to post their methods on an easily-accessible, open source platform geared toward a global, do-it-yourself, environmental science community. It is the team’s hope that other teachers, mentors, and organizations are able to teach using this applied science approach while also collecting meaningful data and bettering their communities.
Students survey trash along a dry section of Chollas Creek located behind their school.
An example of survey results from one question on the SWAMP Rapid Trash Assessment.
The Hydrometeorological Observation Network in California’s Russian River Watershed: Development, Characteristics and Key Findings from 1997 to 2019
May 27, 2020
CW3E postdoc Edwin Sumargo, along with CW3E Director F. Martin Ralph; CW3E members Anna Wilson, Rachel Weihs, Maryam Asgari-Lamjiri, and Luca Delle Monache; NOAA/PSD collaborator Allen White; Sonoma Water collaborator James Jasperse; and USACE/ERDC collaborators Stephen Turnbull and Charles Downer, published a paper in the Bulletin of American Meteorological Society titled “The Hydrometeorological Observation Network in California’s Russian River Watershed: Development, Characteristics and Key Findings from 1997 to 2019” (Sumargo et al. 2020). This work supports the Forecast-Informed Reservoir Operations Priority Area within CW3E’s 2019-2024 Strategic Plan. This article highlights the historical evolution and the current state of the Russian River Hydrometeorological Observing Network (RHONET), and its implications for hydrologic research and operations in Northern California. This network has been built up over 20+ years during several epochs, including most recently in support of Forecast-Informed Reservoir Operations with USACE and Sonoma Water, and with an eye toward developing knowledge of what observations would be needed in the future to support California’s needs for hydrometeorological information related to drought and flood monitoring and mitigation across the state. The paper highlights the inter-agency collaboration involving CW3E, DWR, NOAA, Sonoma Water, and USACE under FIRO to enhance monitoring to improve water resource management and emergency preparedness in the Russian River Basin.
RHONET is a unique suite of high-resolution in-situ and remote-sensing observations deployed over 20 years to address both scientific and operational gaps in understanding, monitoring and predicting weather and water extremes on the United States’ West Coast. It was created over many years by diverse organizations ranging from universities to federal, state, and local government agencies and utilities. Today, RHONET is a hybrid network with diverse observation sets aimed at advancing scientific understanding of physical processes driving extreme precipitation and runoff in the region (Fig. 1). This article describes the development of RHONET, including the specific goals that led to a series of network enhancements, as well as the key characteristics of its sensors. The hydroclimatology of the Russian River area, including hydrologic extremes and variability driving the scientific and operational needs in the region, are reviewed here, from AR behavior and orographic precipitation processes to hydrologic conditions related to water supply and flooding. A case study of Lake Mendocino storage response to a landfalling AR in 2018 demonstrates the network’s performance and hydrologic applications during high-impact weather events. Key scientific findings and applications enabled by the network include the first documentation of the role of landfalling ARs in flooding, the occurrence and importance of shallow non-brightband rain, the buffering influence of extremely dry soils in autumn, and the development of forecast-informed reservoir operations for Lake Mendocino.
Figure 1. Terrain base maps showing (a) the existing RHONET in the Russian River Watershed and the immediate surrounding areas and (b) its development throughout the HMT, Habitat Blueprint, and FIRO epochs. The bold boundaries demarcate the Lake Mendocino Sub-Watershed. Different colors represent different (a) networks and (b) epochs. The inset maps show those within the Lake Mendocino area. The California map on the top right displays the location of Russian River Watershed in California.
Sumargo, E., A.M. Wilson, F.M. Ralph, R. Weihs, A. White, J. Jasperse, M. Asgari-Lamjiri, S. Turnbull, C. Downer, and L. Delle Monache, 2020: The Hydrometeorological Observation Network in California’s Russian River Watershed: Development, Characteristics and Key Findings from 1997 to 2019. Bull. Amer. Meteor. Soc., 0, https://doi.org/10.1175/BAMS-D-19-0253.1