CW3E AR Update: 12 February 2021 Outlook

CW3E AR Update: 12 February 2021 Outlook

February 12, 2021

Click here for a pdf of this information.

Multiple ARs forecast to impact the Western U.S. this weekend into early next week

  • A weak AR brought light-to-moderate precipitation to Northern and Central California yesterday
  • A second AR and associated surface cyclone will approach the U.S. West Coast today, bringing hazardous winter weather to lower elevations in western Washington and northwestern Oregon
  • A third and stronger AR is forecast to make landfall across California and Oregon on Sunday
  • The third AR is forecast to bring AR 2/AR 3 conditions to portions of coastal California and Oregon, but the heaviest precipitation is expected to remain far north of the AR 3 area in California due to the unfavorable orientation of the IVT vectors (parallel to the coast)
  • More than 5 inches of total precipitation are possible in portions of the Pacific Coast Ranges and Cascades during the next 5 days, with the highest amounts forecast in the Oregon Cascades

Click images to see loops of GFS IVT & IWV forecasts

Valid 0600 UTC 12 February – 0600 UTC 17 February 2021


Summary provided by C. Castellano, C. Hecht, J. Kalansky, N. Oakley, and F. M. Ralph; 12 February 2021

*Outlook products are considered experimental

Distribution of Landfalling Atmospheric Rivers over the U.S. West Coast During Water Year 2021: Quarter Year Summary

Distribution of Landfalling Atmospheric Rivers over the U.S. West Coast During Water Year 2021: Quarter Year Summary

February 11, 2021

For a pdf of this information click here.


Link to a post-event summary of the 26 to 29 January 2021 AR here
 

Analysis by Chad Hecht, Jason Cordeira, Julie Kalansky, & F. Martin Ralph. This analysis is considered experimental. For questions regarding the data or methodology please contact Chad Hecht

Estimating Benefits of Forecast-Informed Reservoir Operations (FIRO): Lake Mendocino Case-Study and Transferable Decision Support Tool

Estimating Benefits of Forecast-Informed Reservoir Operations (FIRO): Lake Mendocino Case-Study and Transferable Decision Support Tool

February 11, 2021

Tom Corringham (CW3E) helped develop economic methodologies for assessing benefits of FIRO for a study sponsored by the US Bureau of Reclamation and Sonoma Water. The study was led by economists Dr. Lou Nadeau and Tess Hubbard at Eastern Research Group (ERG), who estimated Lake Mendocino FIRO benefits at over $9Million annually. Caitline Barber (ERG) developed a Decision Support Tool to apply methods to other reservoirs, and the DST was used to test transferability at Prosser Reservoir in the Truckee River Watershed. For more information, see AGU interactive poster here and the Lake Mendocino FVA Section 5.

A New CW3E Fieldwork Season Begins

A New CW3E Fieldwork Season Begins

February 10, 2021

The Center for Western Weather and Water Extremes (CW3E) 2021 fieldwork season is off to a busy start with a series of atmospheric river events that arrived in January. Due to COVID-19, this year’s field season looks a little different than in seasons past. Rather than rotating crews from week-to-week, two dedicated teams headed to Northern California for the full duration of the wet season to sample impactful atmospheric river events.

One team is launching radiosondes from the UC Davis Bodega Marine Laboratory in Bodega Bay, CA (coastal site), while the other is launching from a Yuba Water Agency warehouse in Marysville in Yuba County (Sierra foothills site). The teams have been following all county, state and federal recommended health and safety protocols to minimize COVID risk in the field amidst the ongoing pandemic. Teams have also coordinated with partner organizations including Yuba Water Agency and vetted all fieldwork plans through UCSD’s Research Ramp Up process to ensure we are following the most conservative protocols and staying safe.

One of the first atmospheric river events recorded this season was a moderate event from 26-29 January, with a peak integrated water vapor transport (IVT) of 604.3 kg m-1 s-1 and integrated water vapor (IWV) of 21.06 mm at Bodega Bay at 0556Z 27 January 2021 (Figure 1). The highest precipitation accumulations occurred at the Boyes Creek Canyon location in the Lake Mendocino watershed, which recorded over 2 inches of precipitation between 26 January and 29 January.

In between storm events, the remote field teams hope to install a new soil meteorological (SMOIL) station in the Yuba River Watershed and Micro Rain Radar stand-alone stations in South Lake Tahoe and Truckee, CA. They also plan to conduct maintenance on existing sites in the Russian River watershed.

The CW3E plans to continue releasing radiosondes, and if possible, collecting manual streamflow measurements and isotope samples during atmospheric river events throughout this winter season. The radiosonde data are shared with the National Weather Service WFOs throughout Western Region, as well as transmitted to the Global Telecommunications System for ingest into global numerical weather prediction models. This campaign supports current efforts to understand and improve forecasts of ARs in the Russian River and Yuba/Feather Watersheds, as a part of Forecast-Informed Reservoir Operations (FIRO). For an overview of our collaboration with Yuba Water Agency for data collection for FIRO, head over to their website and read their recent news post here!

A radiosonde launch completed at Bodega Bay (0556Z 27 January 2021) showing the peak IVT recorded at BOD during this AR: 604.3 kg m-1 s-1.

Chad Hecht (Meteorology Staff Researcher) releases a radiosonde from Marysville, CA, on 26 January.

Ava Cooper (Field Researcher) fills a balloon in preparation for a radiosonde launch from UC Davis’s Bodega Bay Marine Lab in Bodega Bay, CA, on 26 January.

CW3E AR Update: 9 February 2021 Outlook

CW3E AR Update: 9 February 2021 Outlook

February 9, 2021

Click here for a pdf of this information.

Unsettled Weather Pattern Forecast to Bring Rain/Snow to Western U.S.

  • A series of low-pressure systems and associated atmospheric rivers (ARs) are forecast to develop over the North Pacific Ocean and move toward the U.S. West Coast during the next 7 days
  • The first two systems are forecast to bring brief periods of weak AR conditions to coastal areas, as well as light-to-moderate precipitation amounts
  • The last system may bring a stronger, longer-duration AR event to Northern California and Oregon, but forecast uncertainty is still high at this time
  • At least 1–3 inches of precipitation are forecast in the Pacific Coast Ranges, Sierra Nevada, Cascades, and higher terrain in north-central Utah, western Wyoming, and western Colorado during the next 7 days
  • More than 4 inches of total precipitation and significant snowfall accumulations are possible in some locations

Click images to see loops of GFS IVT & IWV forecasts

Valid 1200 UTC 9 February – 1200 UTC 17 February 2021


Summary provided by C. Castellano, C. Hecht, B. Kawzenuk, J. Kalansky, and F. M. Ralph; 9 February 2021

*Outlook products are considered experimental

CW3E Publication Notice: A climatology of atmospheric rivers in New Zealand

CW3E Publication Notice

A climatology of atmospheric rivers in New Zealand

February 9, 2021

Hamish Prince, an intern at CW3E, recently published a paper (Prince et al., 2021) in the Journal of Climate along with co-authors including CW3E Researcher Peter Gibson and co-authors from New Zealand at the University of Otago (Nicolas Cullen and Daniel Kingston) and the National Institute for Water and Atmosphere (Jono Conway). This study contributes to the goals of CW3E’s 2019-2024 Strategic Plan to support Atmospheric River (AR) Research and Applications by furthering our understanding of AR dynamics. The research presented in this paper was completed as part of Hamish’s Master of Science degree at the University of Otago, New Zealand, School of Geography.

Similar to the Western United States, New Zealand has been recognized as a ‘hotspot’ region for elevated AR occurrence. Despite this recognition, there has been a distinct lack of regionally focused AR research in New Zealand. Quantifying the large-scale dynamics controlling AR occurrence in various regions across the globe enhances our understanding of ARs, highlighting regional differences and expanding our perspective of AR dynamics. In this study, an AR tracking tool and an AR ranking scheme, both previously developed for the Western United States, were applied to New Zealand to study AR seasonality and probe potential AR impacts in the region. This study uses the Guan and Waliser (2015) AR tracking tool to develop a 40-year database of ARs in the New Zealand region between 1979 and 2019. This study also proposes a novel method to combine the AR tracking tool with CW3E’s Ralph et al. (2019) AR ranking technique.

A strong seasonal cycle of ARs was found for New Zealand, with peak AR occurrence in summer months (DJF) associated with both increased AR frequency and AR rank (Figure 1). The large-scale controls on AR occurrence in New Zealand were also identified, with modulations in the Southern Hemisphere jet stream, cyclone tracks and seasonal moisture variability driving the observed seasonal cycle in ARs. This research then used station-based precipitation records to validate the use of the AR ranking scheme. The proportion of precipitation (total and extreme) during an AR is identified at each study site and the relationship between AR rank and 3-day precipitation is explored. At certain locations, on the windward side of the alpine region, ARs account for up to 78% of total precipitation and 93% of extreme (98th percentile) 6-hourly precipitation. The AR ranking scheme illustrates increases in precipitation at all locations observed, with the greatest increases observed on the windward side of the alps (Figure 2). The greatest AR5 precipitation amounts exceed 1000 mm within 3 days, which are some of the largest AR precipitation volumes recorded anywhere on Earth.

Using research tools previously developed for studying ARs in the Western United States, the Prince et al. (2021) study identifies New Zealand as a key region of AR occurrence with significant hydrometeorological impacts. The linkages made in this study facilitate further study of the environmental and social impact of ARs in New Zealand and provide an important benchmark for assessing how extreme precipitation in New Zealand may change in a warming world.

Figure 1: Seasonality of total ranked AR events at four different locations throughout New Zealand over 40 hydrological years (1979-2019). A seasonal cycle is more pronounced in southern locations (lower two figures), attributed to the greater dependence on the seasonally shifting polar jet. (Adapted from Figure 9 from Prince et al., 2021).

Figure 2: Distribution of 3-day precipitation totals associated with ARs of different rank following initiation of an AR at each study location. The locations on the West Coast of New Zealand, on the windward side of the alps (Hokitika, Cropp River and Ivory Glacier) show the greatest increase in precipitation with AR rank. (Figure 11 from Prince et al., 2021).

Prince, H. D., Cullen, N. J., Gibson, P. B., Conway, J. & Kingston, D. G. (2021). A climatology of atmospheric rivers in New Zealand, J. Climate, https://doi.org/10.1175/JCLI-D-20-0664.1.

CW3E Publication Notice: European West Coast atmospheric rivers: A scale to characterize strength and impacts

CW3E Publication Notice

European West Coast atmospheric rivers: A scale to characterize strength and impacts

February 8, 2021

Jorge Eiras-Barca, along with co-authors Alexandre M. Ramos, Iago Algarra, Marta V´azquez, Francina Dominguez, Gonzalo Miguez-Macho, Raquel Nieto, Luis Gimeno, Juan Taboada, and CW3E Director F. Martin Ralph published a paper in Weather and Climate Extremes assessing the application of the AR Scale (Ralph et al. 2019) to Western Europe. This study contributes to the goals of CW3E’s 2019-2024 Strategic Plan to support Atmospheric River (AR) Research and Applications by exploring the applicability of the AR Scale, which was developed based on ARs impacting the US West Coast, to ARs striking the European West Coast. This also serves to expand the geographical reach of research and applications that were developed by CW3E initially for the western U.S. to other parts of the world – another direction recommended by CW3E stakeholders during the development of the 2019-2024 Strategic Plan.

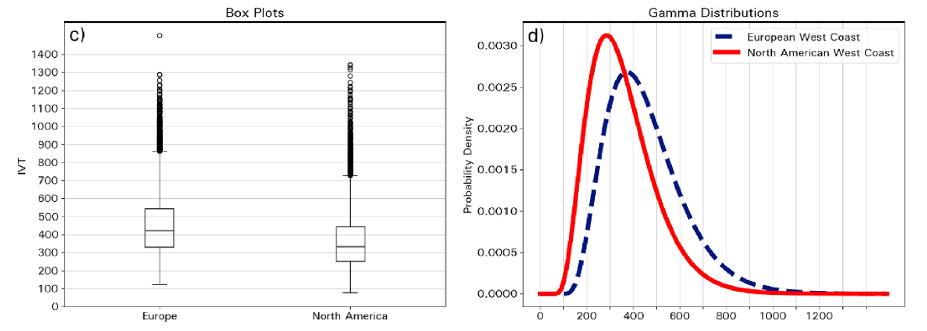
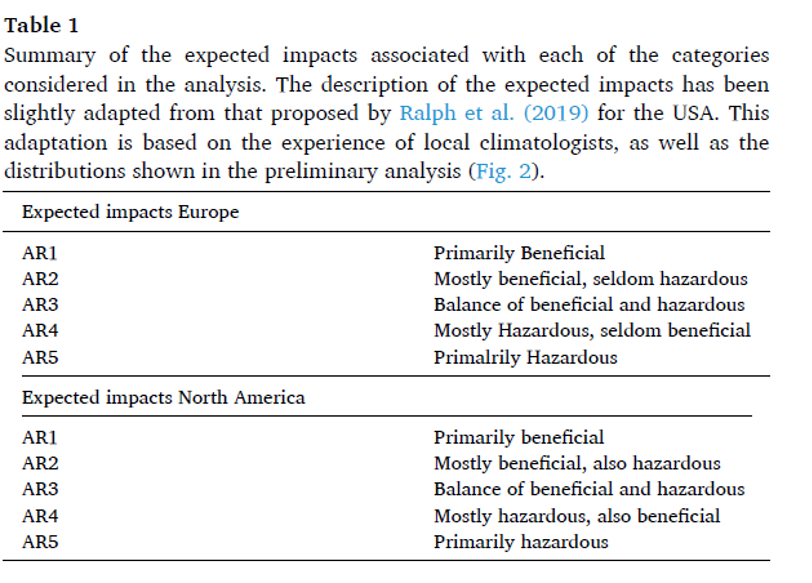
This study first examined the climatology of IVT in western Europe and found somewhat stronger IVT values on average in western European ARs. The most common maximum values were about 100 kg m-1 s-1 greater in Western Europe. However, the ARs of extreme or exceptional intensity, i.e., those having maximum IVT > 1000 kg m-1 s-1, occurred with similar frequency in both regions (Fig. 1). Although the most frequent values of max IVT in landfalling ARs in western Europe were somewhat higher than the US West Coast, the IVT thresholds used by the AR Scale were retained, but the characterization of likely impacts was adjusted. The AR1 and AR5 characterizations remain the same for the European ARs, i.e., primarily beneficial and primarily hazardous. The AR 2, 3 and 4 characterizations were modified (Table 1) to adjust for the shift in the frequency distribution of AR maximum IVT and associated extreme precipitation.

Abstract: This manuscript applies the recently-created atmospheric river intensity and impacts scale (AR Scale) to the European continent. The AR Scale uses an Eulerian perspective based solely upon the time series of integrated vapor transport (IVT) over a given geographic location (often represented by a model or reanalysis “grid cell”). The scale assigns events with persistent, strong IVT at that location to one of five levels (AR1 to AR5), or if the IVT is too weak or short-lived it is determined not to be an AR. AR1 events are primarily beneficial, AR2, 3 and 4 include a mix of beneficial and hazardous impacts, while AR5s are primarily hazardous. The frequency of occurrence, the associated probability of anomalous precipitation and the amount of precipitation explained by each AR rank are provided across Europe for the extended winter season (from October through March). AR1 and AR2 events are the most frequent and explain most of the observed precipitation, but they are associated with a low probability of extreme rainfall. Although AR3, AR4 and AR5 events are much less frequent, and normally provide a smaller fraction of annual precipitation, they are associated with a high probability of extreme rainfall. These results show remarkable variability among the different regions of the European continent. This manuscript also provides an AR detection catalog over Europe for the period 1980–2019, and a simplified version of the algorithm used to rank the events from AR1 to AR5.

Figure 1: IVT distributions for the North American West Coast and European West Coast for AR landfall events throughout the period 1979–2016. Statistical box plot (c) and joint distributions (d) are also shown.

Eiras-Barca, J., Ramos, A.M., Algarra, I., Vazquez, M., Dominguez, F., Miguez-Macho, G., Nieto, R., Gimeno, L., Taboada, J., Ralph, F.M. (2021). European West Coast atmospheric rivers: A scale to characterize strength and impacts, Weather and Climate Extremes, 31, 100305, https://doi.org/10.1016/j.wace.2021.100305.

CW3E Publication Notice: The Circulation Response of a Two-Dimensional Frontogenetic Model to Optimized Moisture Perturbations

CW3E Publication Notice

The Circulation Response of a Two-Dimensional Frontogenetic Model to Optimized Moisture Perturbations

February 8, 2021

Reuben Demirdjian, a CW3E PhD graduate who is currently a Postdoctoral Scholar at the Naval Research Laboratory, recently published a paper in the Journal of the Atmospheric Sciences, along with co-authors and CW3E affiliates Richard Rotunno of the National Center for Atmospheric Research, Bruce D. Cornuelle of Scripps Institution of Oceanography, and Carolyn A. Reynolds, and James D. Doyle of the Naval Research Laboratory (Demirdjian et al. 2021). This study contributes to the goal stated in CW3E’s 2019-2024 Strategic Plan to support modeling capabilities for the western United States by developing and testing coupled weather, ocean, and hydrologic modeling systems to improve prediction of precipitation and streamflow.

The study uses an idealized two-dimensional moist semigeostrophic model to assess the role of moisture small moisture perturbations on developing atmospheric rivers. The objectives are to (i) investigate the dynamics responsible for moisture-perturbation growth, and (ii) quantify the relation between the moisture-perturbation amplitude and the strength of the circulation response. Results show that adding relatively small amounts of moisture can increase frontogenesis, strengthen the transverse circulation, intensify the low-level potential-vorticity (PV) anomaly, and strengthen the low-level jet (LLJ). The progression of physical processes responsible for the nonlinear effect of moisture perturbations on the forecast is (in order) (1) jet/front transverse circulation; (2) moisture convergence ahead of the front; (3) latent heating at mid- to low elevations; (4) reduction in static stability ahead of the front; (5) strengthening of the transverse circulation (Figure 1). Together, these physical processes represent a pathway by which small perturbations of moisture can have a strong impact on a forecast involving midlatitude frontogenesis. The physical processes outlined in Fig. 1 demonstrates that the frontogenetic circulation can respond to moisture perturbations by increasing along front circulations. This advance in our understanding of the dynamics associated with the growth of moist perturbations has led to a more complete understanding of AR dynamics and forecast challenges. This physical argument of a strong precipitation forecast dependence on the initial-condition moisture content highlights the importance of campaigns like Atmospheric River Reconnaissance in regions like the Northeast Pacific that otherwise would have significant gaps without vertically resolved moisture data.

Figure 1: Figure 13 in Demirdjian et al., 2021: A schematic representation of the important physical processes discussed in this study. The potential temperature (gray contours), latent heating (LH; thick red oval), along-front geostrophic wind (color shades with increasing value from orange to red), and the ageostrophic streamfunction (transverse circulation; large black circle). The direction of the transverse circulation is denoted by the black arrows, with successively smaller arrows indicating regions of convergence. The dashed gray lines denote changes to the potential temperature resulting from latent-heating effects. The order of processes is labeled numerically, with dotted black arrows connecting them for continuity. The Brunt–Väisälä frequency before and after the latent heating is measured by N2 and N2s, respectively.

Demirdjian, R., R. Rotunno, B. D. Cornuelle, C. A. Reynolds, and J. D. Doyle, 2021: The Circulation Response of a Two-Dimensional Frontogenetic Model to Optimized Moisture Perturbations. J. Atmos. Sci., 78, 459-472, https://doi.org/10.1175/JAS-D-20-0102.1.

CW3E Event Summary: 26-29 January 2021

CW3E Event Summary: 26-29 January 2021

February 2, 2021

Click here for a pdf of this information.

An Atmospheric River and a Strong Surface Cyclone Produced Significant Impacts Across much of California

  • The AR made landfall at ~00 UTC 27 January in association with a powerful surface cyclone over the Northeast Pacific Ocean
  • Over the next few days, the AR gradually propagated southward along the coast of California, but not before pivoting and stalling over Central California
  • Some areas in Central California experienced AR conditions for nearly 48 consecutive hours, resulting in an AR 2 (based on the Ralph et al. 2019 AR Scale)
  • A strong low-level jet in the warm sector of the surface cyclone led to the development of a narrow cold-frontal rainband (NCFR)
  • Intense rainfall on recent burn scars caused damaging debris flows in Central and Southern California
  • More than 7 inches of precipitation fell in portions of the Sierra Nevada, Central California Coast Ranges, and western Transverse Ranges, with the highest observed amounts in western Monterey and San Luis Obispo Counties
  • Several feet of snow accumulated across the Sierra Nevada, resulting in closures of major highways

Click images to see loops of GFS IVT/IWV analyses

Valid 0000 UTC 26 January – 0000 UTC 30 January


Summary provided by C. Castellano, J. Cordeira, J. Kalansky, N. Oakley, and F. M. Ralph; 2 February 2021

CW3E AR Update: 25 January 2021 Outlook

CW3E AR Update: 25 January 2021 Outlook

January 25, 2021

Click here for a pdf of this information.

Strong atmospheric river may bring several hydrologic impacts to large portion of California early this week

  • A strong atmospheric river (AR) is forecast to make landfall around 4 PM PST tomorrow, 26 January 2021
  • The AR is then forecast to propagate down the coast, bringing AR 1 to potentially 3 conditions to a large stretch of the Central CA Coast.
  • Several locations across the Central Coast and the high elevations of the Sierra could receive more than 10 inches of precipitation.
  • Low freezing levels (<4000 feet) associated with this system could result in 2+ feet of snow over the Coastal and Sierra Nevada Mountains
  • While storm total precipitation could result in numerous impacts, mesoscale models are currently highlighting the potential development of a narrow cold frontal rainband, which could produce high-intensity, short duration, precipitation, a driver of post-fire debris flows.

Click images to see loops of GFS IVT & IWV forecasts

Valid 1200 UTC 25 January – 0000 UTC 2 February 2021


Summary provided by C. Hecht, B. Kawzenuk, N. Oakley, J. Kalansky, and F. M. Ralph; 25 January 2021

*Outlook products are considered experimental