CW3E Event Summary: 4-8 February 2020

CW3E Event Summary: 4-8 February 2020

February 11, 2020

Click here for a pdf of this information.

Landfalling AR brings heavy rainfall, mountain snowfall, and flooding to the Western U.S

  • A long-duration, inland-penetrating AR impacted the Pacific Northwest and Rocky Mountains during 4–8 Feb
  • Some locations in coastal Washington experienced AR conditions for more than 72 hours
  • Total estimated 7-day precipitation between 3 Feb and 10 Feb exceeded 10 inches over the WA Cascades
  • At least 1–3 feet of snow fell over the elevated terrain in the interior Pacific Northwest and the Rocky Mountains
  • Heavy rainfall on top of saturated soils resulted in river flooding and landslides in western WA

Click IVT or IWV image to see loop of GFS analyses

Valid 0000 UTC 4 February – 1800 UTC 8 February 2020


Summary provided by C. Castellano and F. M. Ralph; 11 February 2020

CW3E AR Update: 4 February 2020 Outlook

CW3E AR Update: 4 February 2020 Outlook

February 4, 2020

Click here for a pdf of this information.

A landfalling AR will bring heavy rainfall and mountain snowfall to the Pacific Northwest

  • A landfalling AR is forecast to impact British Columbia, Washington, and Oregon this week
  • Some areas along the Washington and Oregon coast may experience AR conditions for more than 48 hours
  • Prolonged inland penetration of AR conditions is likely over the Intermountain West
  • At least 2–7 inches of precipitation are expected over portions of western Washington and northwestern Oregon during the next 3 days, with at least 12” of snowfall in the North Cascades and portions of the Intermountain West
  • River flooding is possible once again downstream of the Washington Cascades
  • Landfalling AR activity beyond Day 4 (8 Feb) is unlikely as surface high pressure builds over the Northeast Pacific Ocean

Click IVT or IWV image to see loop of GFS analyses/forecasts

Valid 0000 UTC 4 February – 0000 UTC 8 February 2020


Summary provided by C. Castellano, B. Kawzenuk, and F. M. Ralph; 4 February 2020

CW3E Graduate Student Joins Astronaut Jessica Meir for Middle School Outreach Event

CW3E Graduate Student Joins Astronaut Jessica Meir for Middle School Outreach Event

February 4, 2020

Eighth graders from two different middle schools visited Scripps for a morning of inspiration. A Birch Aquarium education fund supported the group of 150+ young students to learn about paths in science from astronaut and Scripps alumna Jessica Meir, and current graduate students.

To begin, middle school students interacted with a panel of Scripps graduate students including Tashiana Osborne (of CW3E), Anai Novoa, Kiefer Forsch, and Ivan Moreno. The PhD students shared how they became interested in science and how they’ve built on training and perseverance to push toward goals.


Scripps PhD student panel including Novoa, Forsch, Osborne, and Moreno (PC: Erik Jepsen, UC San Diego).

Afterward, Astronaut Jessica Meir called in from the International Space Station where she’s been stationed since September 2019. Meir earned her PhD in marine biology at Scripps in 2009. Most recently, she along with Astronaut Christina Koch, made history by completing the first series of all-female space walks. Meir is also recognized as the fourth Jewish woman on a Space Shuttle mission.

The eighth graders from Fulton Middle School and Memorial Preparatory for Scholars and Athletes participated in a question and answer session with Meir, where Meir shared her advice for following dreams and reaching the stars.

Meir’s quoted saying: “I think the most important thing to do is to make sure that you identify your passion and do what it is that you really care about. Once you’ve done that, you do have to work very hard to make those dreams come true.”


Astronaut Jessica Meir sharing from the International Space Station (PC: Erik Jepsen, UC San Diego).


Eighth grade visitors listening in on the graduate student panel and Q&A session with Astronaut Meir (PC: Erik Jepsen, UC San Diego).


Scripps Director Dr. Margaret Leinen, moderator and UCSD astrophysicist Dr. Brian Keating, and Osborne during the event. (PC: UC San Diego)

In the media:

CW3E Event Summary: 26 January – 2 February 2020

CW3E Event Summary: 26 January – 2 February 2020

February 3, 2020

Click here for a pdf of this information.

Active weather pattern brings heavy rainfall and flooding to the Pacific Northwest

  • A series of landfalling ARs resulted in heavy precipitation and river flooding between the last week of January and beginning of February
  • The last landfalling AR produced AR3 conditions along the coast of Washington and Oregon
  • Total estimated 7-day precipitation between 26 Jan and 2 Feb exceeded 5 inches over portions of western WA and northwestern OR, with more than 10 inches over the Olympic Mountains and North Cascades

Click IVT or IWV image to see loop of GFS analyses

Valid 1200 UTC 26 January – 1200 UTC 2 February 2020


Summary provided by C. Castellano, C. Hecht, B. Kawzenuk, and F. M. Ralph; 3 February 2020

CW3E Publication Notice: Current and Emerging Developments in Subseasonal to Decadal Prediction

CW3E Publication Notice

Current and Emerging Developments in Subseasonal to Decadal Prediction

January 31, 2020

Environment and Climate Change Canada (ECCC) scientist Dr. William Merryfield, along with several dozen co-authors including CW3E scientist Dr. Mike DeFlorio, recently published an article in the Bulletin of the American Meteorological Society (BAMS) titled “Current and Emerging Developments in Subseasonal to Decadal Prediction”.

The purpose of this BAMS article is to summarize the current state of Subseasonal-to-Seasonal (S2S) and Seasonal-to-Decadal (S2D) research, and to identify future needs in both the research and operations communities to improve S2S and S2D prediction of weather and climate variables. S2S predictability of atmospheric rivers and precipitation is a key thematic focus area for CW3E, and represents a timescale of prediction that is of vital importance to our stakeholders at the California Department of Water Resources.

The current areas of research interest and particular future needs described in this article were identified during the 2018 International Conferences on Subseasonal to Decadal Prediction in Boulder, CO. These conferences were organized jointly by the World Climate Research Programme (WCRP) and the World Weather Research Programme (WWRP) as an opportunity for the international S2S and S2D research communities to gather together in an effort to share their research and initiate new collaborations.

The BAMS article by Merryfield et al. provides an overview of common challenges to both the S2S and S2D communities, including adequate and accurate representation of physical processes in models that give rise to predictability in the Earth system, reducing model biases and errors that may cause systematic degradation of forecast quality, and communicating uncertainty and providing forecast information to stakeholders in a form that is conducive to better decision making. An overview of both mechanisms and sources of S2S predictability are presented, including the Madden-Julian Oscillation (MJO), sudden stratospheric warming events (SSWs), land-atmosphere interactions such as soil moisture/temperature anomalies and vegetation states, and sea ice variability. Additionally, mechanisms and sources of S2D predictability are also described, including tropical-extratropical teleconnection patterns related to the El Niño-Southern Oscillation (ENSO), SST patterns that vary on decadal timescales in both the Atlantic (Atlantic Multidecadal Variability) and Pacific (Pacific Decadal Variability) Ocean basins, and variations in radiative forcing. These sources of predictability and their associated prediction timescale ranges are summarized below in Figure 1.

Figure 1: Schematic depiction of temporal ranges and sources of predictability for weather and climate prediction. The subseasonal range encompasses the S2S time scales, and the seasonal and annual-to-decadal ranges encompass the S2D time scales that are considered in this work. Longer multi-decadal and centennial ranges derive predictability mainly from forcing scenarios rather than initial conditions, and are typically represented through climate projections originating from historical simulations begun in preindustrial times rather than predictions initialized from more recent observation-based climate states. Figure 1 of Merryfield et al. (2020).

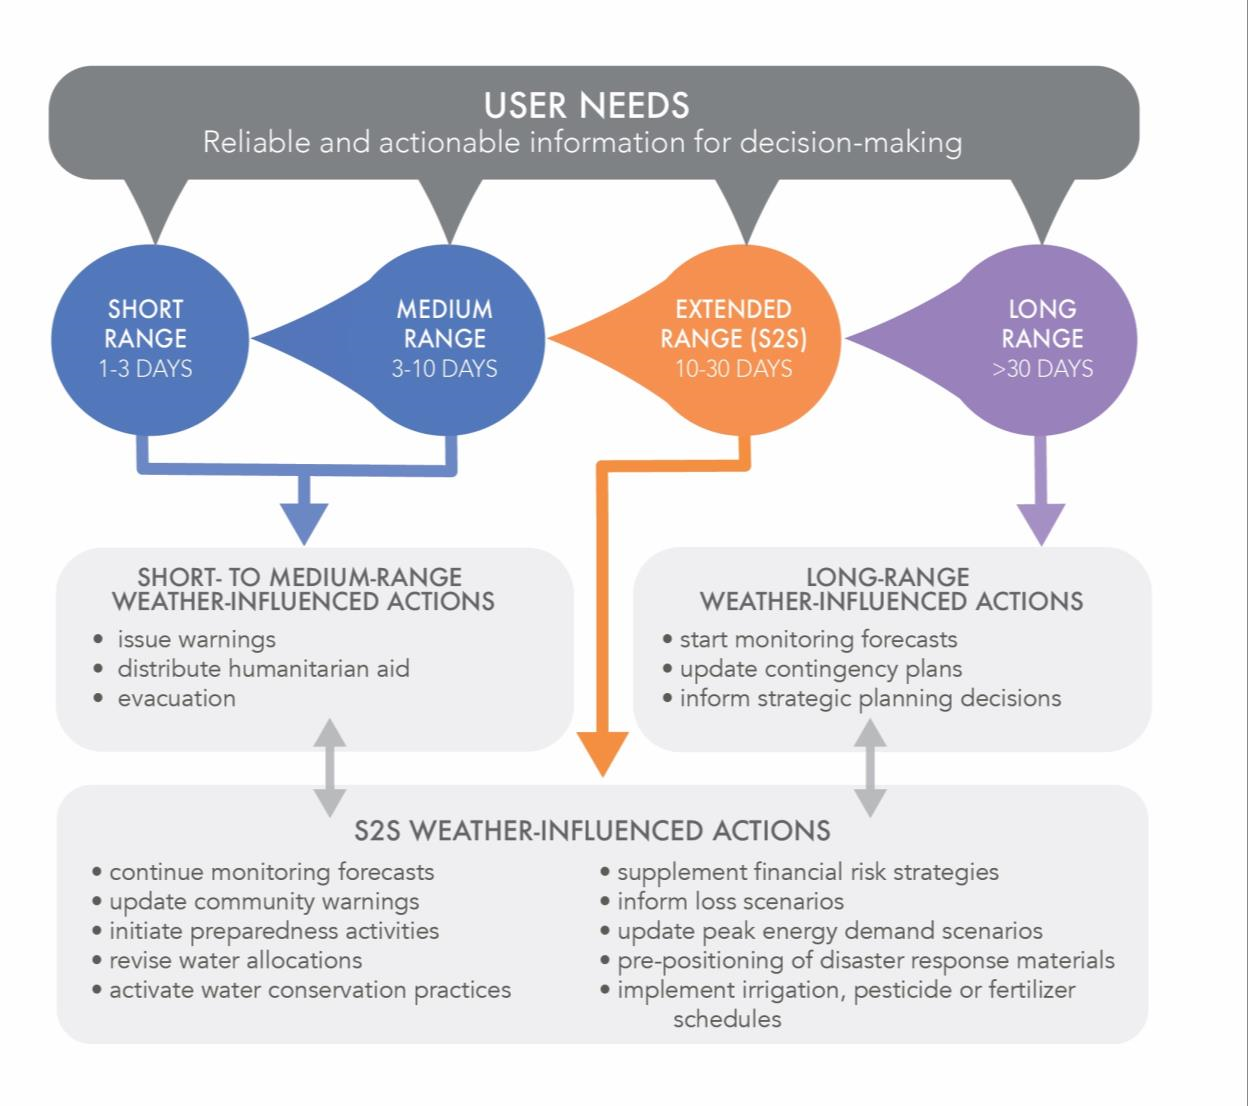
The article also includes a discussion regarding the various applications sectors (including water resource management) and their associated decisions that are influenced by S2S and S2D weather and climate phenomena. A summary of this framework is presented below in Figure 2.

Figure 2: Schematic illustration of relationships between an S2S forecast range of 10-30 days and other prediction timescales, including examples of actionable information that can enable decision making by various sectors. Figure 10 of Merryfield et al. (2020).

Merryfield, W.J., J. Baehr, L. Batté, E.J. Becker, A.H. Butler, C.A. Coelho, G. Danabasoglu, P.A. Dirmeyer, F.J. Doblas-Reyes, D.I. Domeisen, L. Ferranti, T. Ilynia, A. Kumar, W.A. Müller, M. Rixen, A.W. Robertson, D.M. Smith, Y. Takaya, M. Tuma, F. Vitart, C.J. White, M.S. Alvarez, C. Ardilouze, H. Attard, C. Baggett, M.A. Balmaseda, A.F. Beraki, P.S. Bhattacharjee, R. Bilbao, F.M. de Andrade, M.J. DeFlorio, L.B. Díaz, M.A. Ehsan, G. Fragkoulidis, S. Grainger, B.W. Green, M.C. Hell, J.M. Infanti, K. Isensee, T. Kataoka, B.P. Kirtman, N.P. Klingaman, J. Lee, K. Mayer, R. McKay, J.V. Mecking, D.E. Miller, N. Neddermann, C.H. Justin Ng, A. Ossó, K. Pankatz, S. Peatman, K. Pegion, J. Perlwitz, G.C. Recalde-Coronel, A. Reintges, C. Renkl, B. Solaraju-Murali, A. Spring, C. Stan, Y.Q. Sun, C.R. Tozer, N. Vigaud, S. Woolnough, and S. Yeager, 2020: Current and emerging developments in subseasonal to decadal prediction. Bull. Amer. Meteor. Soc., 0 https://doi.org/10.1175/BAMS-D-19-0037.1

CW3E Publication Notice: Skill of rain-snow level forecasts for landfalling atmospheric rivers: A multi-model model assessment using California’s network of vertically profiling radars

CW3E Publication Notice

Skill of rain-snow level forecasts for landfalling atmospheric rivers: A multi-model model assessment using California’s network of vertically profiling radars

January 30, 2020

Water resources managers must deal with substantial uncertainty in the forecasting of rain-snow levels during atmospheric river (AR) events in California, a new CW3E study shows. Major winter AR storms bring a highly variable mix of rain and snow to the Sierra Nevada; warmer events have higher rain-snow levels and thus produce more rain, greater flood risk, and contribute less to seasonal snowpack and water supply. The study showed that while operational weather models can forecast rain-snow levels well on average, they frequently had errors in rain-snow levels of several hundred meters, large enough to introduce major uncertainty in flood and water resources planning. This study is a part of CW3E’s ongoing effort to understand and improve the predictions of ARs and their impacts on public safety and water management, supporting local water agencies, California Department of Water Resources, the U.S. Army Corps of Engineers, and other agencies.

In the study by Brian Henn, Rachel Weihs, Andrew C Martin, F. Martin Ralph, and Tashiana Osborne of CW3E, forecasts of atmospheric rain-snow levels from December 2016 to March 2017, a period of active AR landfalls, were evaluated using 19 profiling radars in California. Three forecast model products were assessed: a global forecast model downscaled to 3 km grid spacing, 4 km river forecast center operational forecasts, and 50 km global ensemble reforecasts. Model forecasts of the rain-snow level were compared with observations of rain-snow melting level brightband heights. Models produced median bias magnitudes of less than 200 m across a range of forecast lead times. However, error magnitudes increased with lead time and were similar between models, averaging 342 m for lead times of 24 hr or less and growing to 700-800 m for lead times of greater than 144 hr. Significantly for flood forecasting, observed extremes in the rain-snow level were underestimated, particularly for warmer events, and the magnitude of errors increased with rain-snow level. Storms with high rain-snow levels were correlated with larger observed precipitation rates in Sierra Nevada watersheds. Flood risk increases with rain-snow levels, not only because a greater fraction of the watershed receives rain, but also because warmer storms carry greater water vapor and thus can produce heavier precipitation. The uncertainty of flood forecasts was shown to non-linearly with the rain-snow level for these reasons as well, highlighting the importance of improving forecast accuracy for flood risk management.

To aid water resources managers and the public, CW3E provides visualizations of current operational rain-snow level forecasts and their uncertainty for the U.S. West Coast.

The effect of rain-snow level forecast uncertainty on flood forecasting: a) schematic showing how the rain-snow level controls the fraction of precipitation received as rain in mountain watershed.. Bottom panels shows how rain-snow level forecast errors contributes most to flood risk uncertainty for high rain-snow level (warm) AR events, using the Merced River watershed above New ExchequerDam as an example: b) rain-snow level forecast error ranges as a function of observed rain-snow levels, c) rain-snow fraction ranges, d) precipitation rate ranges, and e) watershed rain rate ranges. Forecast uncertainty produces the largest watershed rain rate uncertainty for the warmest ARs.

Henn, B., R. Weihs, A.C. Martin, F.M. Ralph, and T. Osborne (2020): Skill of rain-snow level forecasts for landfalling atmospheric rivers: A multi-model model assessment using California’s network of vertically profiling radars. J. Hydrometeor., 124, 0 https://doi.org/10.1175/JHM-D-18-0212.1

CW3E AR Update: 29 January 2020 Outlook

CW3E AR Update: 29 January 2020 Outlook

January 29, 2020

Click here for a pdf of this information.

A landfalling AR will bring heavy rainfall and the potential for flooding to the Pacific Northwest

  • A landfalling AR is forecast to impact British Columbia, Washington, and Oregon this week
  • Some areas along the coast may experience AR3/AR4 conditions, but there is significant uncertainty in forecast AR Scale
  • At least 3–7 inches of rainfall are expected over portions of western WA and OR during the next 5 days, with more than 7 inches possible over the Olympic Peninsula and North Cascades
  • Surface high pressure will build over the Northeast Pacific Ocean during 1–3 Feb
  • Additional landfalling AR activity is currently forecast on the poleward side of the surface high between 4 Feb and 7 Feb

Click IVT or IWV image to see loop of GFS analyses/forecasts

Valid 0000 UTC 29 January – 0000 UTC 3 February 2020


Summary provided by C. Castellano, C. Hecht, B. Kawzenuk, and F. M. Ralph; 29 January 2020

CW3E AR Update: 24 January 2020 Outlook

CW3E AR Update: 24 January 2020 Outlook

January 24, 2020

Click here for a pdf of this information.

Active weather pattern will bring frequent AR activity and rainfall to the Pacific Northwest

  • A series of storms over the Northeast Pacific Ocean will result in frequent episodes of AR conditions over the next 7 days
  • Total 7-day precipitation amounts in excess of 5 inches are forecast over extreme northwestern California, the Oregon Coast Ranges, the Olympic Peninsula, and the Cascades
  • Long-range ensemble forecasts suggest the potential for additional landfalling AR activity during the first week of February

Click IVT or IWV image to see loop of GFS analyses/forecasts

Valid 1200 UTC 24 January – 1200 UTC 31 January 2020


Summary provided by C. Castellano; 24 January 2020

International Naval Officers Visit to Hear from Scripps Researchers

International Naval Officers Visit to Hear from Scripps Researchers

January 23, 2020

In January, Scripps personnel Tashiana Osborne (CW3E graduate student), Dr. Fiammetta Straneo (physical oceanographer and professor), and Dr. Jeff Bowman (biological oceanographer and assistant professor) presented research to a group of visiting senior naval officers. The delegation, comprising of 60 high-ranking naval officers from around the world, joined as part of a Naval Command College (NCC) program. The NCC program is designed to build and strengthen cooperation between the U.S. Navy and international navies.

Every year, nominated representatives from over 40 countries attend the residential program based in Newport, Rhode Island. The 11-month experience “…is designed to build trust, confidence, and cooperation between American and international officers.” It centers on developing strategic planning skills and gaining “…understanding of American government, human rights, and the role of the free press and free market”. To do so, representatives complete both formal courses and field studies involving out-of-area trips like the Scripps visit.

Prior to their visit, the delegation requested presentations focused on the oceans and atmosphere in a changing climate. Scripps personnel were honored to fulfill this request and interact with a diverse team of decorated leaders.

During the visit, Osborne presented on atmospheric rivers and extreme weather events in a current and future climate. She also highlighted CW3E efforts to work between research, private, and government sectors. Bowman shared about ocean expeditions and research insights from MOSAiC: Modern Oceanography and the Changing Arctic Ocean, on which he serves as a team lead. Straneo spoke on drivers and consequences of rapidly melting ice in Greenland. She shared experiences during field campaigns she has led, emphasizing the value of observations when it comes to understanding interactions between polar ice, oceans, and the atmosphere.

Before leaving campus for the day, the naval delegation toured the Scripps Pier. Of their visit, the group had to say: “The visit was truly rewarding and contributed significantly towards accomplishing our academic objectives for the trip.”


International senior naval officers and NCC personnel including NCC Director Captain Kevin McGowan and Captain William Shipp, joined by Scripps presenters, Osborne and Straneo (PC: Brandi Bangle).

CW3E Publication Notice: Tracking Atmospheric Rivers Globally: Spatial Distributions and Temporal Evolution of Life Cycle Characteristics

CW3E Publication Notice

Tracking Atmospheric Rivers Globally: Spatial Distributions and Temporal Evolution of Life Cycle Characteristics

January 22, 2020

CW3E collaborators Bin Guan (UCLA Project Scientist) and Duane Waliser (Chief Scientist of NASA/JPL Earth Science and Technology Directorate) recently published an article in the Journal of Geophysical Research: Atmospheres, titled “Tracking Atmospheric Rivers Globally: Spatial Distributions and Temporal Evolution of Life Cycle Characteristics”. The paper is included in the journal’s special issue on “Atmospheric Rivers: Intersection of Weather and Climate”. The research was supported by the California Department of Water Resources (DWR), the NASA Energy and Water cycle Study (NEWS) program, and the NASA GOES-16/17 special task.

The study documents Version 3, the latest iteration of the continual improvements in the Tracking Atmospheric Rivers Globally as Elongated Targets (tARget) algorithm, adding the capability to track AR life cycles globally along with other refinements. The algorithm was initially published in Guan and Waliser (2015) and later updated in Guan, Waliser, and Ralph (2018). As one of a few peer-reviewed and validated global AR detection algorithm currently available, the algorithm has been a vital tool used by scientists within the AR research and operations community, including many scientists at CW3E.

Using output from tARget Version 3, the study quantitatively characterized AR life cycles around the globe, including their spatial distributions, temporal evolution, and seasonal dependence, and examined the sensitivity of selected AR life cycle characteristics to various tracking considerations. It is expected that the consideration of AR life cycles will provide new insights into better understanding the fundamental processes of ARs – such as their moisture sources and pathways – and the representation of such processes in weather and climate models, and help improve our ability in predicting AR activity and impacts on subseasonal-to-seasonal (S2S) and longer time scales. S2S and seasonal prediction of ARs (and lack thereof, i.e., drought) is currently a key science and applications area of interest to DWR and with DWR-supported research and experimental forecast activities ongoing at CW3E, JPL, and UCLA.

Figure 1: Example output from the tARget algorithm, showing the track of one longer-lived AR (red) alongside other shorter-lived ARs. Only the 0600 time step every two days is shown for conciseness. The contour labels indicate the unique ID assigned to each track by the algorithm. For a given track, the ID number is populated to all grid cells within the boundary of all the AR shapes that belong to the given track. Key statistics for each track (lifetime, travel distance, mean travel speed, etc.; not shown) are also included in the output database. From Guan and Waliser 2019 (Figure 4).

Figure 2: Life cycle characteristics of ARs tracked by the tARget algorithm summarized from the results presented earlier. (upper) Spatial distributions of the long-term climatology. Smoothing was applied to highlight the most pronounced features. (lower) Temporal evolution of a typical/composite AR life cycle. Locations of the AR centroids (white dots) and track (light blue curve) are determined by propagating an AR centroid from an arbitrary starting point (here, 170°W, 36°N) forward in time based on the composite travel speed/direction at each stage of its life cycle as shown in Figure 15. Results are based on ~126,000 AR tracks in the NASA MERRA-2 reanalysis during 1980–2017. From Guan and Waliser 2019 (Figure 17).

Guan, B., & Waliser, D. E. (2019): Tracking Atmospheric Rivers Globally: Spatial Distributions and Temporal Evolution of Life Cycle Characteristics. Journal of Geophysical Research: Atmospheres, 124, 12523-12552 https://doi.org/10.1029/2019JD031205