CW3E Participates in 3rd ARTMIP Workshop

CW3E Participates in 3rd ARTMIP Workshop

October 21, 2019

The 3rd Atmospheric River Tracking Method Intercomparison Project (ARTMIP) Workshop was recently held at Lawrence Berkeley National Laboratory (LBNL) in Berkeley, California.

ARTMIP, started in 2017, is a collaborative effort to understand and quantify the uncertainty in atmospheric river (AR) climatology, precipitation, and impacts that arise because of different AR detection/tracking methodologies, and investigate how these AR-related metrics may change in the future. The climatological characteristics of ARs, such as AR frequency, duration, intensity, and seasonality, are all strongly dependent on the method used to identify ARs. Meanwhile, the uncertainty in precipitation attributable to ARs has significant implications for our understanding of how ARs contribute to regional hydroclimate now and in the future. The ARTMIP project also aims to provide guidance regarding the advantages and disadvantages of these different AR detection/tracking methods, and which of these methods are best suited to answer certain scientific questions.

The goals of the 3rd ARTMIP workshop were:

  • Presentation of results from recent and ongoing ARTMIP research: Tier 1* and beyond (with a focus on Tier 2*)
  • Working discussion of current and future ARTMIP experiments and papers
  • Solicitation of expert identification of atmospheric rivers and other weather phenomena for machine learning

(*ARTMIP Tier 1: Participants run their algorithms on a common dataset and adhere to a common format. Act as a baseline for all Tier 2 subtopics. Tier 2: Designed to test sensitivities and dig into topical science questions.)

Several members of CW3E are participating in ARTMIP and attended the 3 rd ARTMIP Workshop in Berkeley, including Allison Michaelis, Christopher Castellano, Cody Poulsen, Michael
DeFlorio, and Zhenhai Zhang. Allison presented her high-resolution simulations using the Model for Prediction Across Scales (MPAS) for use in climate change studies. Allison’s simulations provide an additional dataset to ARTMIP and could be used to examine AR variability based on ENSO, investigate the impacts of increased model resolution (15-km) on the simulation of ARs, and explore the consistency of the climate change signals across modeling frameworks. Zhenhai shared his work on the relationship between ARs and extratropical cyclones in the workshop when the relevant questions were raised. Following his previous work, Zhenhai will investigate the interaction between ARs and cyclones through their life cycles using the AR tracking methods from ARTMIP, as well as explore the uncertainties due to different AR tracking methods.

The main outcome of the workshop will be to produce a workshop report and summary paper describing how detection method uncertainty affects our understanding of ARs – particularly with respect to AR impacts, variability, and trends. The report includes four sections: (1) Introduction to ARTMIP, lead by Christine Shields from NCAR; (2) Ongoing ARTMIP Activities, lead by Jonathan Rutz from NWS; (3) AR Tracking Uncertainty, lead by Ashley Payne from University of Michigan; and (4) ARTMIP Going Forward, lead by Travis O’Brien from LBNL.

For more information on ARTMIP, visit the ARTMIP website.

CW3E AR Update: 17 October Outlook

CW3E AR Update: 17 October Outlook

October 17, 2019

Click here for a pdf of this information.

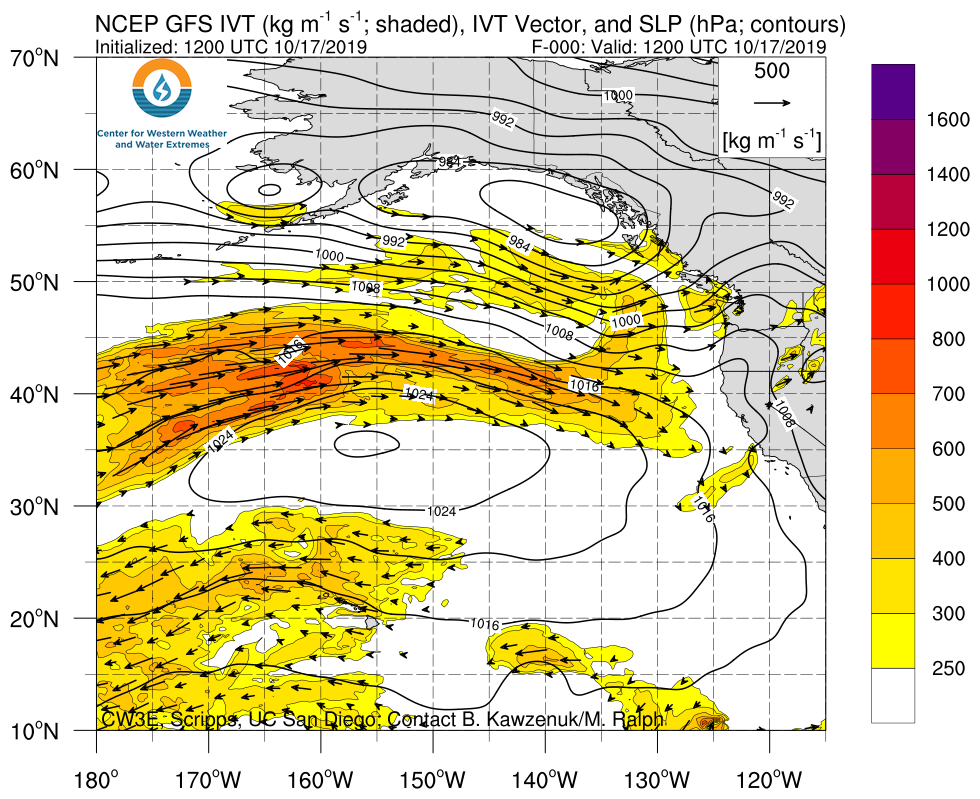
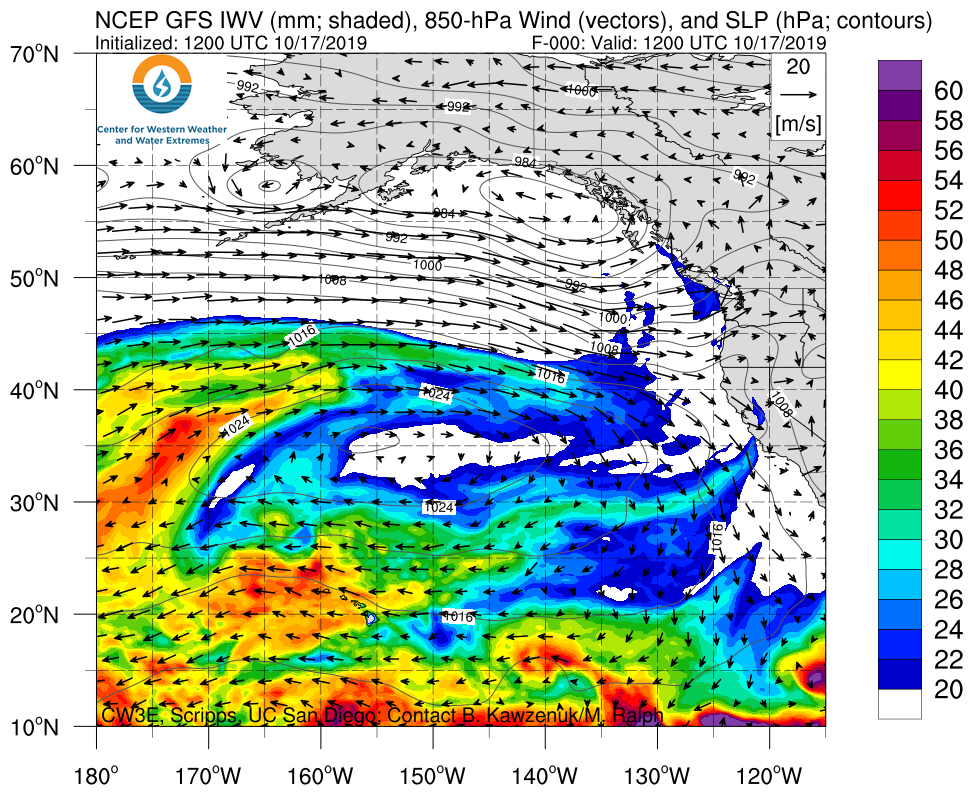
Pacific Northwest Forecast to Receive Extended Duration of AR Conditions Next Week

  • A series of systems is forecast to bring several days of atmospheric river conditions to the Pacific Northwest
  • While uncertainty is currently high, southern Washington and Northern Oregon could experience AR condition durations >50-hours
  • Maximum IVT magnitudes over Coastal Pacific Northwest could exceed 750 units
  • Due to the long duration and potential for strong IVT magnitude, the NOAA WPC is currently forecasting as much as 15 inches of precipitation over the higher elevations of the Pacific Northwest

Click IVT or IWV image to see loop of 0-180 hour GFS forecasts

Valid 1200 UTC 17 October – 0000 UTC 25 October 2019


Summary provided by C. Hecht, B.Kawzenuk, J. Kalansky, F. M. Ralph; 3 PM PT 17 October 2019

CW3E Welcomes Ava Cooper

CW3E Welcomes Ava Cooper

October 1, 2019

Ava Cooper joined CW3E as a Field Researcher in September 2019. In 2017, Ava earned her BS in Climate Science from Oregon State University where she conducted snow surveys in the Mackenzie River basin. Ava completed her Masters in Hydrology at the University of Nevada, Reno in August 2019 as part of Adrian Harpold’s Nevada Mountain Ecohydrology Lab. She conducted her research in the beautiful Sagehen Creek watershed, north of Lake Tahoe, where she focused on snowmelt-driven differences in tree water use in the Sierra Nevada. During this time, Ava deployed sensors to measure sap flow, snow, and surface meteorology in Sagehen Creek watershed. Her thesis work was comprised of an empirical analysis of tree water use using the sap flow data as well as a model intercomparison project on land surface model skill in predicting key characteristics of seasonal transpiration. The research showed that earlier soil moisture limitations on tree water use, driven by earlier snow disappearance, shifted peak tree water use earlier in the growing season and earlier snow disappearance led to longer durations of soil moisture limitations on tree water use. The model intercomparison found that more complex representations of transpiration were necessary to simulate the timing of seasonal peak tree water use.

As part of the field research team at CW3E, Ava will support observational efforts in the Forecast Informed Reservoir Operations (FIRO) Program. Ava is excited to support snow-related research efforts and continue studying snow hydrology, meteorology, and climate science in the Sierra Nevada, California.

CW3E Post Event Summary: 22-26 September 2019

CW3E Post Event Summary: 22-26 September 2019

September 27, 2019

Click here for a pdf of this information.

Active synoptic pattern brings heavy rainfall and severe weather to central and southeastern Arizona

  • Portions of central and southeastern AZ received > 2 inches of rainfall during the 7-day period ending 12 UTC (5 AM PST) 27 September
  • The highest rainfall amounts (> 3 inches) occurred over the elevated terrain in Maricopa, Gila, Yavapai, Pima, Santa Cruz, and Cochise Counties
  • Roosevelt Dam (Gila County) recorded a 7-day total of 7.62 inches, with more than 6 inches falling during the 12-hour period ending 00 UTC 24 September (5 PM PST 23 September)
  • Flash flooding and severe thunderstorms were reported during the morning and afternoon of 23 September
  • Strong synoptic-dynamic forcing and moisture from the remnants of Tropical Storm Mario both played important roles in this event


Summary provided by C. Castellano, B. Kawzenuk, J. Kalansky, F. M. Ralph; 4 PM PT 27 September 2019

CW3E Event Summary: 23-25 Sep 2019

CW3E Event Summary: 23-25 September 2019

September 25, 2019

Click here for a pdf of this information.

Active synoptic pattern brings heavy rainfall to central and southeastern Arizona

  • A large swath of central AZ received over 1.5 inches of rainfall during the 24-hour period ending 12 UTC (5 AM PST) 24 Sep
  • The highest rainfall amounts (> 3 inches) occurred over the elevated terrain in Maricopa, Gila, and Yavapai Counties
  • Roosevelt Dam (Gila County) recorded 7.55 inches during the 48-hour period ending 17 UTC (10 AM PST) 24 Sep
  • Localized flash flooding, hail, and damaging winds were also reported during the evening of 23 September
  • Additional heavy rainfall and thunderstorms are expected over the next couple of days, primarily in southeastern Arizona
  • Strong synoptic-dynamic forcing and moisture from the remnants of Tropical Storm Mario both played important roles in this event


Summary provided by C. Castellano, B. Kawzenuk, J. Kalansky, F. M. Ralph; 2 PM PT 25 September 2019

CW3E Publication Notice: Atmospheric River Families: Definition and Associated Synoptic Conditions

CW3E Publication Notice

Atmospheric River Families: Definition and Associated Synoptic Conditions

September 16, 2019

CW3E graduate student, Meredith Fish, along with co-authors Anna Wilson and Marty Ralph, published a paper in the Journal of Hydrometeorology entitled, “Atmospheric River Families: Definition and Associated Synoptic Conditions”.

Atmospheric rivers (AR) can cause flooding when they are strong and stall over an already wet watershed. While earlier studies emphasized the role of individual, long-duration ARs in triggering floods, it is not uncommon for floods to be associated with a series of ARs that strike in close succession. This study uses measurements from an atmospheric river observatory at Bodega Bay (BBY), in Northern California, to identify periods when multiple AR events occurred in rapid succession. Here, an AR “event” is the period when AR conditions are present continuously at BBY. An objective method is developed to identify such periods, and the concept of “AR families” is introduced.

During the period studied there were 228 AR events. Using the AR family identification method, a range of aggregation periods (the length of time allowed for ARs to be considered part of a family) were tested. For example, for an aggregation period of 5 days, there were 109 AR families, with an average of 2.7 ARs per family. Over a range of possible aggregation periods, typically there were 2-6 ARs per family.

Compared to single AR events, the synoptic environment of AR families is characterized by lower geopotential heights throughout the mid-latitude North Pacific, an enhanced subtropical high, and a stronger zonal North Pacific jet. Analysis of water year 2017 demonstrated a persistent geopotential height dipole throughout the North Pacific and a positive anomaly of integrated water vapor extending toward California. AR families were favored when synoptic features were semi-stationary.

Figure 1 shows the synoptic conditions associated with AR family conditions at BBY compared to a December – February climatology.

Figure 1: Composites of all 120-hour AR families at BBY, with anomalies shaded and DJF climatology in contour lines, of the following variables: A) 500-hPa geopotential heights (m), B) 250-hPa wind speed (m/s), C) 850-hPa geopotential heights (m), D) IWV (mm).

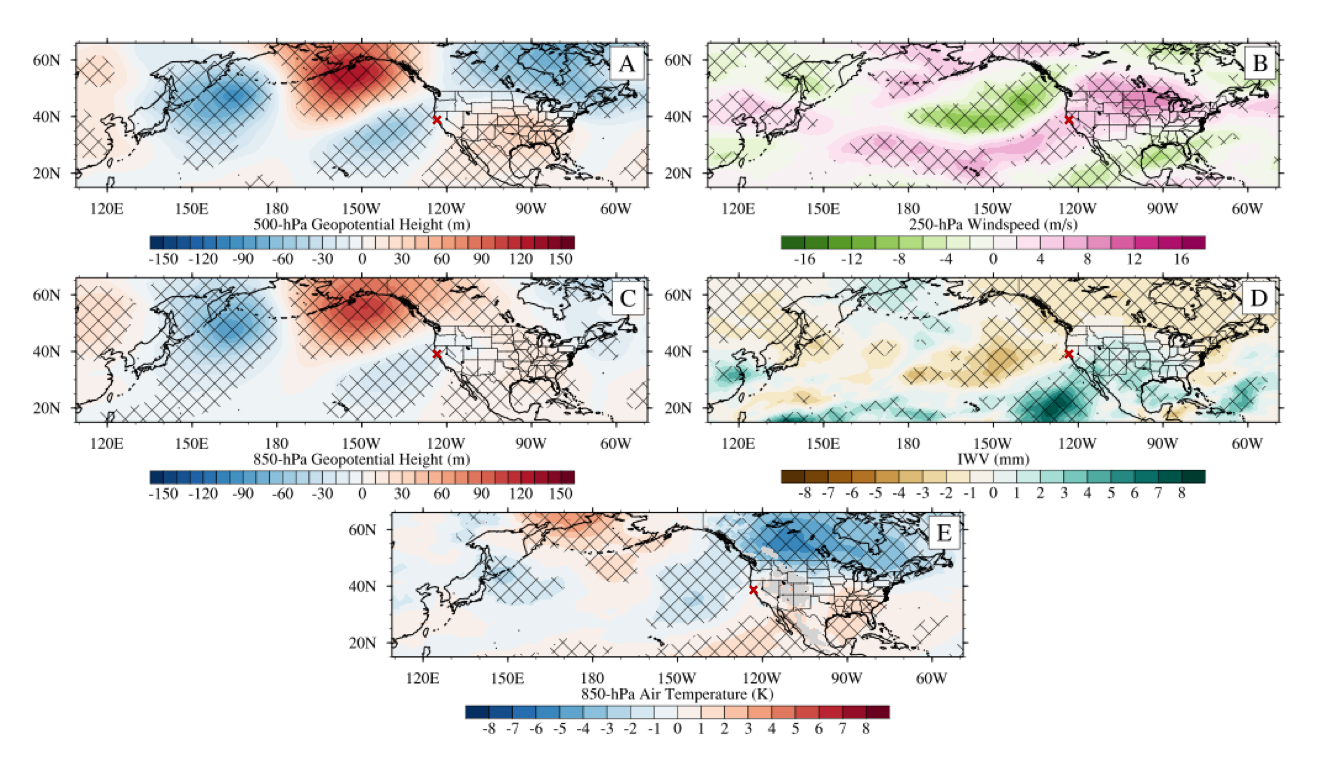
Figure 2 highlights WY 2017 and the Rossby wave train like conditions that were present during that WY leading to the largest number of AR families detected during this catalog.

Figure 2: Composites of the difference between WY 2017 AR families (n = 208 time steps) and AR families. Significance at 99% confidence marked by hatching. A) 500-hPa geopotential heights (m), B) 250-hPa wind speed (m/s), C) 850-hPa geopotential heights (m), D) IWV (mm), E) 850-hPa temperature (K).

Figure 3 shows an example of a notable AR family, making landfall in early February 2017. The culmination of these events coincided with the Oroville Dam incident in Northern California.

Figure 3: Time evolution of notable AR events in February 2017 showing the integrated water vapor transport, IVT (kg/m/s, colored contour) and 850-hPa geopotential heights (m, contour).

Figures are every 24 hours starting on 03 February 2017 at 0000 UTC to 10 February 2017 0000 UTC from left to right, top to bottom.

Fish, M.A, A.M. Wilson, F.M. Ralph: Atmospheric River Families: Definition and Associated Synoptic Conditions. J. Hydromet., doi:10.1175/JHM-D-18-0217.1

CW3E Publication Notice: Linking Bay Area Landslides and Atmospheric Rivers

CW3E Publication Notice

Linking Bay Area Landslides and Atmospheric Rivers

September 12, 2019

CW3E affiliate Professor Jay Cordeira of Plymouth State University (PSU), along with co-authors Jon Stock and Mike Dettinger of the USGS, Allison Young of PSU, Julie Kalansky and Marty Ralph of CW3E, published a paper in the Bulletin of the American Meteorological Society entitled “A 142-yr climatology of northern California landslides and atmospheric rivers”. The study introduces the eponymous 142-yr record of landslides in the San Francisco Bay Area, and compares that long record to a record of atmospheric-river landfalls in the area. Extreme precipitation often impacts ecosystems, agriculture, infrastructure, and water resources through resulting floods, erosion, and “mass movements”. Mass movements refers to various ways that large segments of earth, rocks, and debris can move downhill when conditions are right to allow them to break free from their usual settings to flow down steep hillslopes and valleys. When landslides meet infrastructure of almost any type, consequences can be dire. For example, recently, the U.S. Geological Survey estimated that annual losses in the US from landslides are between $2 billion and $4 billion, with an average of 25-50 people killed each year.

The study uses the 142-yr record of San Francisco Bay Area landslides between 1871 and 2012 to explore the relationship between 214 days on which landslides are known to have occurred and the contemporaneous weather. Landslides in the San Francisco Bay Area occur during winter with a peak in January and February and most often in coastal areas with steep topography in Sonoma, Marin, San Mateo, and Santa Cruz Counties. Some 76% of the identified landslide days occurred when strong atmospheric water vapor fluxes typical of atmospheric rivers arrived and persisted for ~20 h or more. A triggering factor for the landslides is intense precipitation, with rainfall rates above the 98th percentile of all storms in the area. A more detailed examination of the weather conditions on those landslide days indicates that 82% of the landslide days coincided with ARs over the near-offshore northeast Pacific. These results suggest that extreme precipitation associated with landfalling ARs precede or may trigger an overwhelming majority of landslides across the San Francisco Bay Area, a finding that should allow for much more focused landslide-hazard advisories in winters to come.

Figure 1: Number of well-dated landslide-onset dates in the San Francisco Bay Area from 1871–2012 (a) by month of year with and without concurrence of integrated water-vapor transport magnitudes ≥250 kg m–1 s–1 just offshore, and (b) by county per decade.

Cordeira, J., Stock, J., Dettinger, M., Young, A., Kalansky, J., and Ralph, F.M., 2019: A 142-Year Climatology of Northern California Landslides and Atmospheric Rivers. Bull. Amer. Meteor. Soc., 100, 1499-109 https://doi.org/10.1175/BAMS-D-18-0158.1

CW3E Welcomes Christopher Castellano

CW3E Welcomes Christopher Castellano

September 11, 2019

Christopher Castellano joined CW3E as a Meteorology Staff Researcher in September 2019. He received a B.S. in Atmospheric Science from Cornell University (2010) and an M.S. in Atmospheric Science from the University at Albany, SUNY (2012). His master’s thesis investigated the climatological aspects of ice storms in the northeastern U.S., with an emphasis on the associated synoptic and mesoscale processes. After completing graduate school, Chris worked as a Research Support Specialist at the Northeast Regional Climate Center, where he evaluated several methods for downscaling extreme precipitation from global climate models. Most recently, he worked as a Research Associate at the European Severe Storms Laboratory in Wessling, Germany. In this role, he evaluated the predictability of severe thunderstorm environments in decadal climate model simulations and developed a hail event simulation routine to analyze the historical and future risk of large hail in Central Europe.

Chris will provide research support for a variety of projects at CW3E, including the subseasonal-to-seasonal (S2S) prediction of atmospheric rivers, the Forecast Informed Reservoir Operations (FIRO) project, and the development of operational forecast tools for atmospheric rivers and extreme precipitation. His research interests lie in the areas of synoptic-dynamic meteorology, applied climatology, hydrometeorology, and risk analysis of natural hazards.

Congratulations to Dr. Lamjiri – CW3E Graduate Student Successfully Defends Dissertation

Congratulations to Dr. Lamjiri – CW3E Graduate Student Successfully Defends Dissertation

September 10, 2019

The first CW3E PhD student has successfully defended her dissertation. Dr. Maryam Lamjiri’s defense was held on Thursday, September 5. Her dissertation title is “Characteristics, Origins, and Recent Trends in Extreme Precipitation in the United States Including the Role of Atmospheric Rivers,” and includes two chapters published in peer-review journals (Lamjiri et al., 2017; Lamjiri et al., 2018), and one currently under review at the Journal of Hydrometeorology. Maryam’s committee members were Marty Ralph (Chair), Adrian Borsa, Jan Kleissl, Joel Norris, Michael Dettinger, and Shang Ping Xie.

Maryam has been selected to participate in the Insight Data Science Fellowship program in Los Angeles. Her future plans are to pursue job opportunities in the field of data science and to explore potential applications of machine learning in hydrometeorology.

CW3E is incredibly proud of Maryam’s accomplishment!

Maryam Lamjiri defending her dissertation.

The traditional Scripps Institution of Oceanography post-defense celebration at Surfside.

Lamjiri, M.A., M.D. Dettinger, F.M. Ralph, and B. Guan, (2017). Hourly Storm Characteristics along the U.S. West Coast: Role of Atmospheric Rivers in Extreme Precipitation. Geophysical Research Letters, 44. doi:10.1002/2017GL074193.

Lamjiri, M. A, Dettinger, M. D, Ralph, F. M, Oakley, N. S, & Rutz, J. J. (2018). Hourly Analyses of the Large Storms and Atmospheric Rivers that Provide Most of California’s Precipitation in Only 10 to 100 Hours per Year. San Francisco Estuary and Watershed Science. , 16(4).

CW3E Publication Notice: Improving Atmospheric River Forecasts with Machine Learning

CW3E Publication Notice

Improving Atmospheric River Forecasts with Machine Learning

August 27, 2019

CW3E graduate student Will Chapman, along with co-authors Aneesh Subramanian, Luca Delle Monache, Shang Ping Xi, and Marty Ralph, published a paper in Geophysical Research Letters entitled “Improving Atmospheric River Forecasts with Machine Learning”.

Machine learning methods are data-driven algorithms that improve by examining massive amounts of existing data. This study explores the utility of a computer-vision machine learning technique to reduce error in numerical weather forecasts of integrated vapor transport (IVT), the characteristic field for atmospheric rivers (ARs). ARs are long narrow corridors of anomalous vapor transport capable of providing both beneficial and hazardous precipitation. Therefore, accurately forecasting AR events is extremely important from a water supply and flood protection standpoint. The study presents a forecast post-processing method (dubbed “ARcnn”), which relies on machine learning to correct the IVT field output from the National Center for Environmental Prediction’s Global Forecast System (GFS) for the Eastern Pacific and Western North America. Results show significant forecast improvements after applying machine learning postprocessing for lead times ranging from 3 hours to 7 days, making the predictions more valuable to stakeholders affected by AR events. Figure 1 shows an example of a 4-day forecasted AR event that is corrected by the machine learning method.

Figure 1: Forecasts and analysis valid for IVT fields on 29 November 2017. (a) MERRA-2 analysis field with the IVT = 600 kg m-1s-1 contour (solid) and dominant storm axis (dotted) as determined by IVT > 350 kg m-1s-1 raw image moment. (b) GFS 96-hour forecast with the MERRA-2 600 IVT contour and dominant storm axis. (c) ARcnn-IVT 96-hour forecast with the MERRA-2 600 IVT contour and dominant storm axis. (d) Difference between ARcnn-IVT and GFS. (e) Difference between GFS and MERRA-2 IVT field. (f) Difference between GFS and MERRA-2 IVT field.

The method offers improved prediction for integrated vapor transport events affecting the Western United States and could lead to better preparation for forecasted precipitation. Figure 2 (Figure 3 in the paper) shows the improvement of four error metrics over the raw GFS forecast. The method reduces full field root mean squared error (RMSE) at forecast leads from 3 hours to 7 days (9-17% reduction), while increasing correlation between observations and predictions (0.5-12% increase). This represents a ~1-2-day lead time improvement in RMSE at 7 days.

Figure 2: Region of Interest average temporal evolution of (a) Bias, (b) CRMSE, (c) RMSE, and (d) PC of raw GFS, ARcnn, persistence (Pers), and climatology (Climo) forecasts. Resampled bootstrap variance intervals are shown for each forecast.

Chapman, W. E., Subramanian, A. C., Delle Monache, L., Xie, S. P., & Ralph, F. M. (2019). Improving Atmospheric River Forecasts with Machine Learning. Geophysical Research Letters, 46. https://doi.org/10.1029/2019GL083662