CW3E Launches Radiosonde with Potter Valley Elementary School Students

CW3E Launches Radiosonde with Potter Valley Elementary School Students

April 16, 2017

CW3E’s Reuben Demirdjian and Anna Wilson recently conducted a demonstration radiosonde launch at the Potter Valley Fire Department for the Potter Valley Elementary School in the Russian River Watershed. The 5th and 6th grade classes, taught by Lori Clark and Merri Emerson respectively, were very enthusiastic participants in the demonstration launch. During the event the students showed their interest while asking a seemingly endless supply of questions about how the information is collected and why it it is useful. The students wrote a message on the to be launched radiosonde’s plastic exterior (Go Bearcats!), and released the balloon. Topics covered included the research done with the collected data, how the information gained from our experiments might help their strong agricultural community, why the balloon expands as it rises, what the sensors attached to the balloon measure, and how far the balloon might go (atmospheric layers were discussed!). Reuben and Anna, along with CW3E’s Douglas Alden, were also able to interact with the same classes at the start of the 2017 field season in January, when they deployed ground instrumentation including a vertically pointing radar, optical disdrometers, rain gauges, and more instrumentation at the Potter Valley Fire Department. The instrumentation at the Potter Valley Fire Department site has collected a valuable dataset over this historic winter season and CW3E is grateful for the support and collaboration and looks forward to a strong relationship going forward.

CW3E graduate student Reuben Demirdjian gets ready to hand off the radiosonde and balloon to two capable Potter Valley Elementary School students to sample a vertical profile of the atmosphere; Potter Valley Elementary School students watch the balloon ascend.

Key California precipitation index hits record yearly level after only 7 months

Key California Precipitation Index Hits Record Yearly Level After Only 7 Months

April 13, 2017

Click here for a pdf of this information.

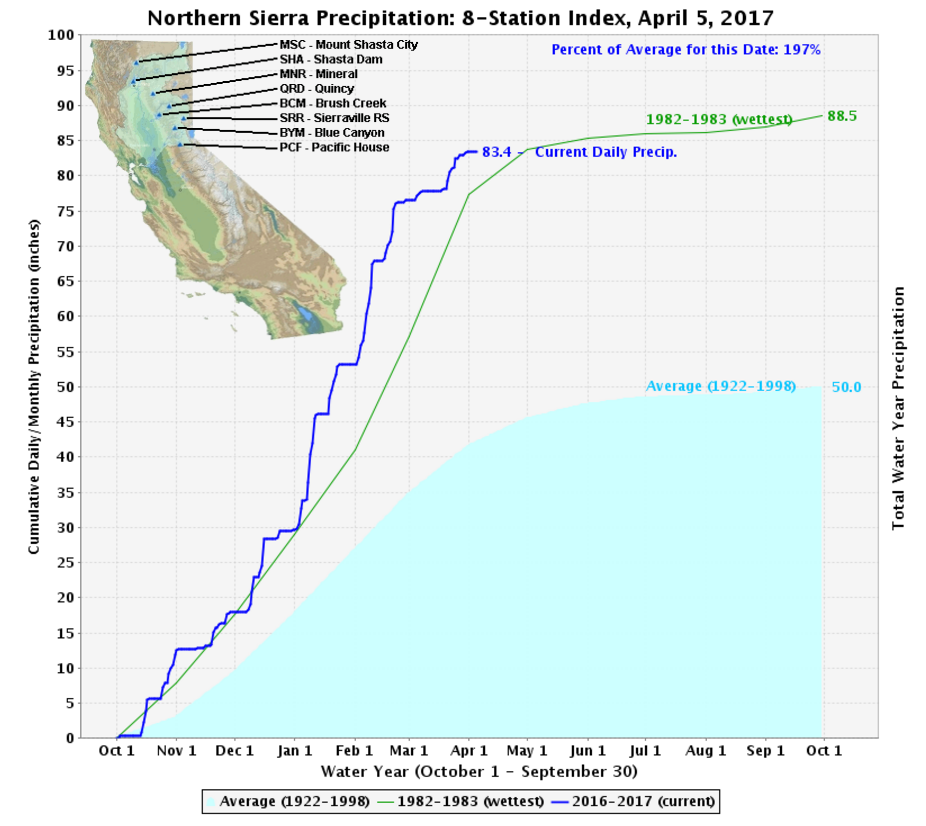
A key index of California precipitation observations at eight stations in the Northern Sierra Nevada has set a new record high level after less than 7 months, beating the previous record that took 12 months of accumulation to set. A series of atmospheric rivers (ARs) that brought heavy precipitation to the state, especially in Jan and Feb, largely accounts for the record total accumulation.


Summary provided by F.M. Ralph, D. Pierce, C. Hecht, M. Dettinger, and D. Cayan; 2 PM PT Thursday 13 April 2017

CW3E Shares Science with Prospective Students at Triton Day

CW3E Shares Science with Prospective Students at Triton Day

April 13, 2017

Each year, the University of California, San Diego (UCSD) organizes Triton Day, a day for prospective undergraduate students and their families to explore the campus and all it has to offer. Falling on Saturday, April 8th this year, Triton Day provided visitors with information on everything from academic tracks and requirements to financial aid and support for adjusting to college life. Tours of the UCSD main campus and Scripps Institution of Oceanography (SIO) were also offered throughout the day.

CW3E shared current research efforts during the the day’s Academic Information Fair. Prospective students and family members were drawn in by the various weather instruments on display, measuring wind speed and direction, temperature, humidity, rainfall amount, atmospheric pressure, and incoming solar radiation.

Similar instruments are used by CW3E to make observations helping address weather and water-related science questions. Researchers, including graduate and undergraduates students, use measurements from these instruments to study atmospheric rivers and their impacts. Observations also feed into CW3E’s weather model, West-WRF, which is specifically tailored to provide forecasts for the West Coast.

Douglas Alden, engineering mentor, and Tashiana Osborne, Climate Sciences graduate student, speaking with visitors about meteorological instruments and ongoing CW3E research. Photo credit: Brittany Hook; SIO Communications Coordinator.

CW3E Publication Notice: High-Impact Hydrologic Events and Atmospheric Rivers in California: An Investigation using the NCEI Storm Events Database

CW3E Publication Notice

High-Impact Hydrologic Events and Atmospheric Rivers in California: An Investigation using the NCEI Storm Events Database

April 12, 2017

Two 2016 graduates of the M.S. Applied Meteorology program at Plymouth State University, Klint Skelly (May 2016) and Allison Young (December 2016) advised by CW3E Affiliate Dr. Jason Cordeira, worked collectively on understanding the fraction of floods, flash floods, and debris flows (termed high-impact hydrologic events, or HIHEs) that are associated with landfalling ARs in California.

The HIHE–AR relationship was studied over a 10-water year period from Oct 2004 through Sep 2014 with HIHE reports obtained from the National Centers for Environmental Information (NCEI) Storm Events Database and AR dates obtained from a catalog of landfalling ARs from Rutz et al. (2013). Some detailed results are provided below. More information is contained in a manuscript that was recently published in the AGU Geophysical Research Letters: Young, A. M., K. T Skelly, and J. M. Cordeira, 2017: High-Impact Hydrologic Events and Atmospheric Rivers in California: An Investigation using the NCEI Storm Events Database. Geophys. Res. Lett., 44, doi:10.1002/2017GL073077. click here for personal use pdf file

Key Results: A total of 1,415 HIHE reports in California during the 10-year period of study reduced to 580 HIHE days across the different National Weather Service County Warning Areas (CWAs). A large majority (82.9%) of HIHE days occur over southern California; however, a larger fraction of HIHEs are associated with landfalling ARs across northern California (80.8%) as compared to southern California (41.8%). The 580 HIHE days across the different CWAs, when combined, reduced to 364 unique HIHE days for the state of California. A larger number of HIHE days statewide occur during summer (57.1%) as compared to winter (42.9%). Conversely, a larger fraction of HIHE days associated with ARs occur in winter (78.2%) as compared to summer (25.0%), which corresponds to similar values obtained by Neiman et al., (2008) and Ralph and Dettinger (2012).

Figure caption: Total number of HIHE days per (a) CWA and (b–d) month for (b) all of California, (c) northern California, and (d) southern California. The blue bars and denominator represent the total number of HIHE days, whereas the white hatched bars and numerator represent the total number of HIHE days associated with ARs.

The 580 HIHE days across different CWAs, when combined by region, reduced to 88 unique HIHE days for northern California and 301 unique HIHE days for southern California. A larger number of HIHE days across northern California occur during winter (62.5%) as compared to summer (37.5%), whereas a larger number of HIHE days across southern California occur during summer (60.8%) as compared to winter (39.2%). The fraction of these HIHE days that are associated with ARs is higher over northern California (63.6%) as compared to southern California (39.2%).

This study illustrated that HIHE days contained within the NCEI Storm Events Database for CWAs across California can be attributed to landfalling ARs and their associated precipitation extremes. This attribution is largely valid for HIHE days across northern California in the cold season and not necessarily valid for HIHE days across southern California during the warm season. Approximately 57% of all HIHE days in California occurred during the warm-season, mostly in conjunction with flash floods, and 75% of these HIHE days were not associated with ARs. The composite analysis of flash flood days across California illustrated the climatological warm-season flow pattern for precipitation across southern California and closely resembled the type-IV monsoon synoptic pattern as defined by Maddox et al. (1980). This result motivates additional future work that could focus on the role of the North American monsoon and other non-AR processes that produce HIHEs across California.

Support for this project was provided by the State of California-Department of Water Resources and the U.S. Army Corps of Engineers, both as part of broader projects led by CW3E. Dr. Cordeira and his graduate students at Plymouth State University actively collaborate with CW3E on topics related to atmospheric rivers, such as analyzing, understanding, and forecasting their impacts along the U.S. West Coast.

CW3E AR Update: 11 April 2017 Outlook

CW3E AR Update: 11 April 2017 Outlook

April 11, 2017

Click here for a pdf of this information.

AR Currently Impacting West Coast

  • An AR is currently impacting Northern CA producing widespread precipitation over the region
  • A second AR is forecast to merge with the current AR, prolonging AR conditions over Northern CA
  • .25 to .88 inches of precipitation has already fallen across portions of Northern CA with >2.5 inches forecasted for higher elevations
  • This event could produce enough precipitation to make water year 2017 the wettest year recorded by the Northern Sierra 8-station index

SSMI Integrated Water Vapor (IWV)

Valid 10-11 April 2017

Click IVT or IWV image to see loop of 0-51 hour GFS forecast

Valid 1200 UTC 11 April – 1500 UTC 11 April 2017

A second AR with a separate parent low-pressure system is forecast to merge with the current AR, which could prolong AR conditions over portions of Northern CA


Summary provided by C. Hecht and F.M. Ralph; 1 PM PT Tuesday 11 April 2017

How Many Atmospheric Rivers Have Hit the U.S. West Coast During the Remarkably Wet Water Year 2017?

How Many Atmospheric Rivers Have Hit the U.S. West Coast During the Remarkably Wet Water Year 2017?

April 6, 2017

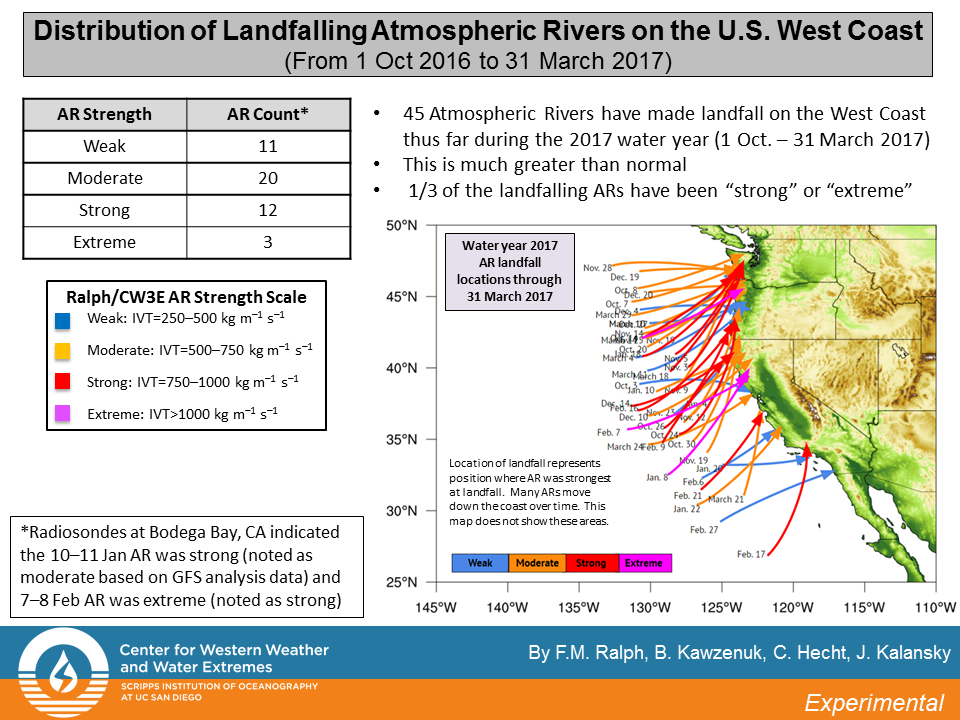
It has been well established that much of the west coast receives roughly 30-50% of its annual precipitation from landfalling atmospheric rivers. One of the goals of CW3E is to provide timely information on atmospheric rivers and their impacts on water in the West. The analysis presented here is based upon examination of AR conditions on each day from 1 October 2016 through 31 March 2017. Research-based criteria for AR identification have been used, especially the strength of integrated vapor transport (IVT). ARs are also ranked according to a simple scale introduced in 2016 (see inset in the graphic for the scaling).

As would be expected, one reason this winter has been so wet in the west is the large number of landfalling ARs. In addition, a large fraction of these events has been strong, or even extreme, in magnitude, and have caused serious flooding, and incidents like the Oroville Dam spillway issue.

Contacts: F. Martin Ralph, Chad Hecht, Brian Kawzenuk

There have been 45 total atmospheric rivers that have made landfall over the U.S. West coast from 1 October to 31 March 2017. Of the 45 total ARs, 10 have been Weak, 20 have been Moderate, 12 have been Strong, and 3 have been Extreme (Based on IVT magnitude). 1/3 of the landfalling ARs have been “strong” or “extreme”.

The large number of ARs that have made landfall over the U.S. West Coast have produced large amounts of precipitation. The Northern Sierra 8-station index is currently at 83.4 inches, which is just 5.1 inches below the wettest year on record with seven months remaining in the water year. The graphic below, from the California Department of Water Resources, highlights this information.

Odds of Reaching 100% Water Year Precipitation – Apr Update

Odds of Reaching 100% of Normal Precipitation for Water Year 2017 (April Update)

April 6, 2017

Contribution from Dr. M.D. Dettinger, USGS

The odds shown here are the odds of precipitation in the rest of the water year (after March 2017) totaling a large enough amount to bring the water-year total to equal or exceed the percentage of normal listed. “All Yrs” odds based on monthly divisional precipitation totals from water year 1896-2015. Numbers in parenthesis are the corresponding odds if precipitation through March had been precisely normal (1981-2010 baseline).

Click here for a pdf file of this information.


How these probabilities were estimated:

At the end of a given month, if we know how much precipitation has fallen to date (in the water year), the amount of precipitation that will be required to close out the water year (on Sept 30) with a water-year total equal to the long-term normal is just that normal amount minus the amount received to date. Thus the odds of reaching normal by the end of the water year are just the odds of precipitation during the remaining of the year equaling or exceeding that remaining amount.

To arrive at the probabilities shown, the precipitation totals for the remaining months of the water year were tabulated in the long-term historical record and the number of years in which that precipitation total equaled or exceeded the amount still needed to reach normal were counted. The fraction of years that at least reached that threshold is the probability estimate. This simple calculation was performed for a full range of possible starting months (from November thru September) and for a wide range of initial (year-to-date) precipitation conditions. The calculation was also made for the probabilities of reaching 75% of normal by end of water year, 125%, and 150%, to ensure that the resulting tables of probabilities cover almost the full range of situations that will come up in the future.

[One key simplifying assumption goes into estimating the probabilities this way: The assumption that the amount of precipitation that will fall in the remainder of a water year does not depend on the amount that has already fallen in that water year to date. This assumption was tested for each month of the year by correlating historical year-to-date amounts with the remainder-of-the-year amounts, and the resulting correlations were never statistically significantly different from zero, except possibly when the beginning month is March, for which there is a small positive correlation between Oct-Mar and Apr-Sept precipitation historically.]

Contact: Michael Dettinger (USGS)

CW3E AR Update: 04 April 2017 Outlook

CW3E AR Update: 04 April 2017 Outlook

April 04, 2017

Click here for a pdf of this information.

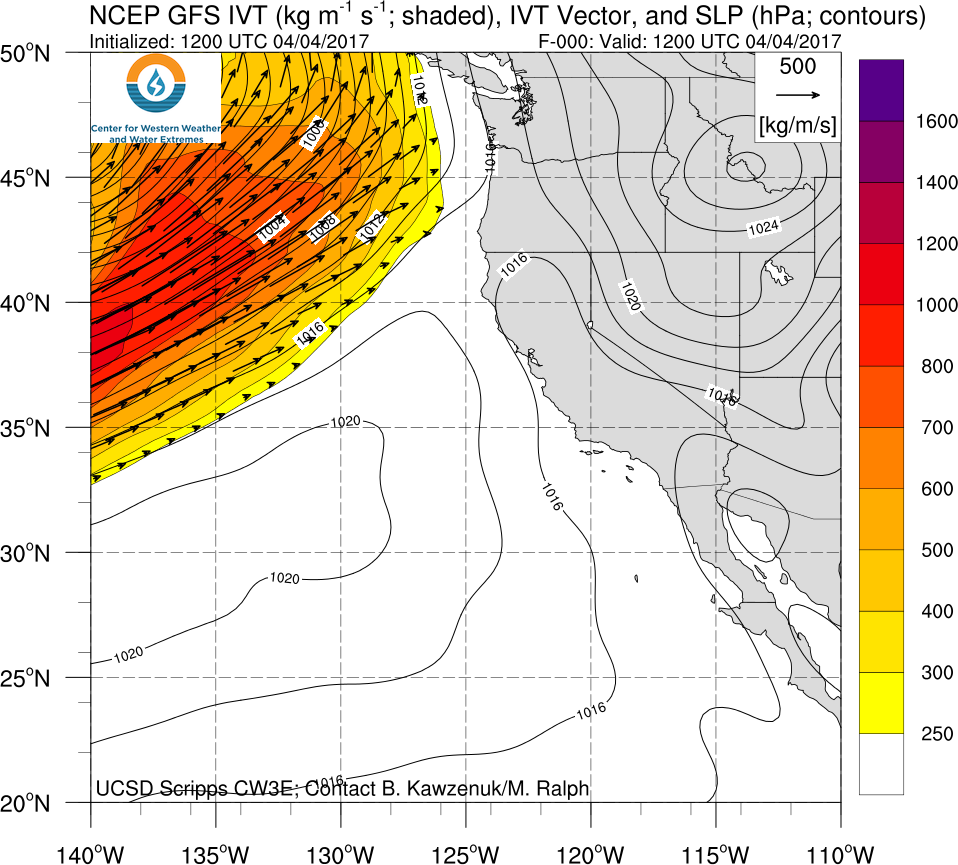
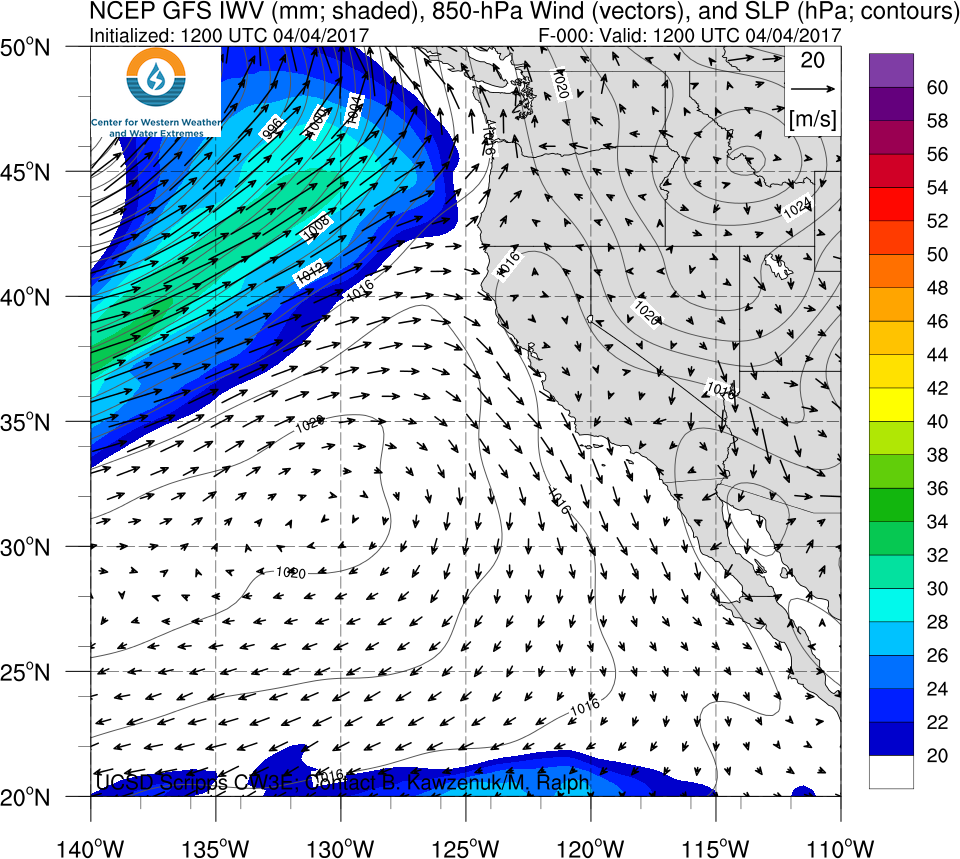
AR conditions Forecast for Entire U.S. West Coast

  • An AR is currently impacting the Pacific Northwest while another AR is forecast to make landfall over Northern CA on Thursday
  • A mesoscale frontal wave that develops during the second AR could prolong the duration of AR conditions but uncertainty is currently high
  • 1–5 day precipitation forecasts are >6 inches over the high elevations of the Coastal Mts., Northern Sierra Mts., and Trinity Alps
  • Freezing levels are forecast to start at ~7,000 feet before dropping to ~3,000 feet, causing this to be a snow event for higher elevations
  • Wet soil and the potential for rain on snow at lower elevations raises the concern for flooding in eastern California and northern Nevada

Click IVT or IWV image to see loop of 0-114 hour GFS forecast

Valid 1200 UTC 04 April – 0600 UTC 09 April 2017


Summary provided by C. Hecht and F.M. Ralph; 1 PM PT Tuesday 04 April 2017

CW3E Visits the NWS California Nevada River Forecast Center

CW3E Visits the NWS California Nevada River Forecast Center

March 31, 2017

The NWS California Nevada River Forecast Center (CNRFC) in Sacramento, CA, which provides essential hydrologic forecasts to stakeholders, recently hosted CW3E’s Dr. Anna Wilson for a day of shadowing CNRFC team members. She benefitted greatly from observing the operating procedures of expert Hydrometeorological Analysis and Support (HAS) forecasters Holly Osborne and Kyle Lerman, and Senior Hydrologist Pete Fickenscher. Dr. Wilson was also able to tour the State-Federal Flood Operations Center. This is collocated with the CNRFC, NWS Sacramento, and the California Department of Water Resources to leverage those agencies’ strong commitment and significant contributions to supporting emergency and water management agencies in California. The CW3E visit to CNRFC offered an opportunity to share perspectives on the historic 2016-2017 winter season, and to talk about current research activities, modeling efforts, and topics of common interest.

From left to right: Holly Osborne (CNRFC HAS Forecaster), Mike Imgarten (CNRFC Hydrologist), Anna Wilson (CW3E postdoc), Kyle Lerman (CNRFC HAS Forecaster), and Scott Staggs (CNRFC Senior Hydrologist).

CW3E AR Update: 16 March 2017 Outlook

CW3E AR Update: 16 March 2017 Outlook

March 16, 2017

Click here for a pdf of this information.

Two ARs Forecast to Impact West Coast Over the Next Week

  • First AR to make landfall over Oregon Friday morning and primarily impact the Pacific Northwest and Northern CA
  • Second AR is forecast to impact Oregon and Northern CA beginning Monday Morning
  • Coastal Oregon could potentially experience strong AR conditions around 8 PM PDT Friday associated with first AR
  • Second AR could bring moderate AR conditions to Northern California but forecast confidence is currently low
  • Precipitation forecasts range from 2 to 4.8 inches over the high elevations of Northern California and the Pacific Northwest

Click IVT or IWV image to see loop of 0-150 hour GFS forecast

Valid 1200 UTC 16 March – 1800 UTC 22 March 2017


Summary provided by C. Hecht and F.M. Ralph; 1 PM PT Thurs 16 March 2017