CW3E AR Update: 4 October 2016 Summary and Outlook
October 14, 2016
For up to date AR forecasts visit the CW3E AR Portal.
Click here for a pdf file of this information.


CW3E AR Update: 4 October 2016 Summary and Outlook
October 14, 2016
For up to date AR forecasts visit the CW3E AR Portal.
Click here for a pdf file of this information.
CW3E AR Update: 13-15 October 2016 Outlook
October 12, 2016
A series of ARs are expected to make landfall over the Northwest U.S., including Northern CA. The first AR is expected to make landfall on 13 October 2016 followed by a second AR on 15 October 2016. These systems have R-Cat 2 rainfall potential as some areas could see >12 inches of precipitation in 72 hours. For up to date AR forecasts visit the CW3E AR Portal.
Click here for a pdf file of this information.


CW3E Represented at NWS San Diego’s WeatherFest 2016
September 22, 2016
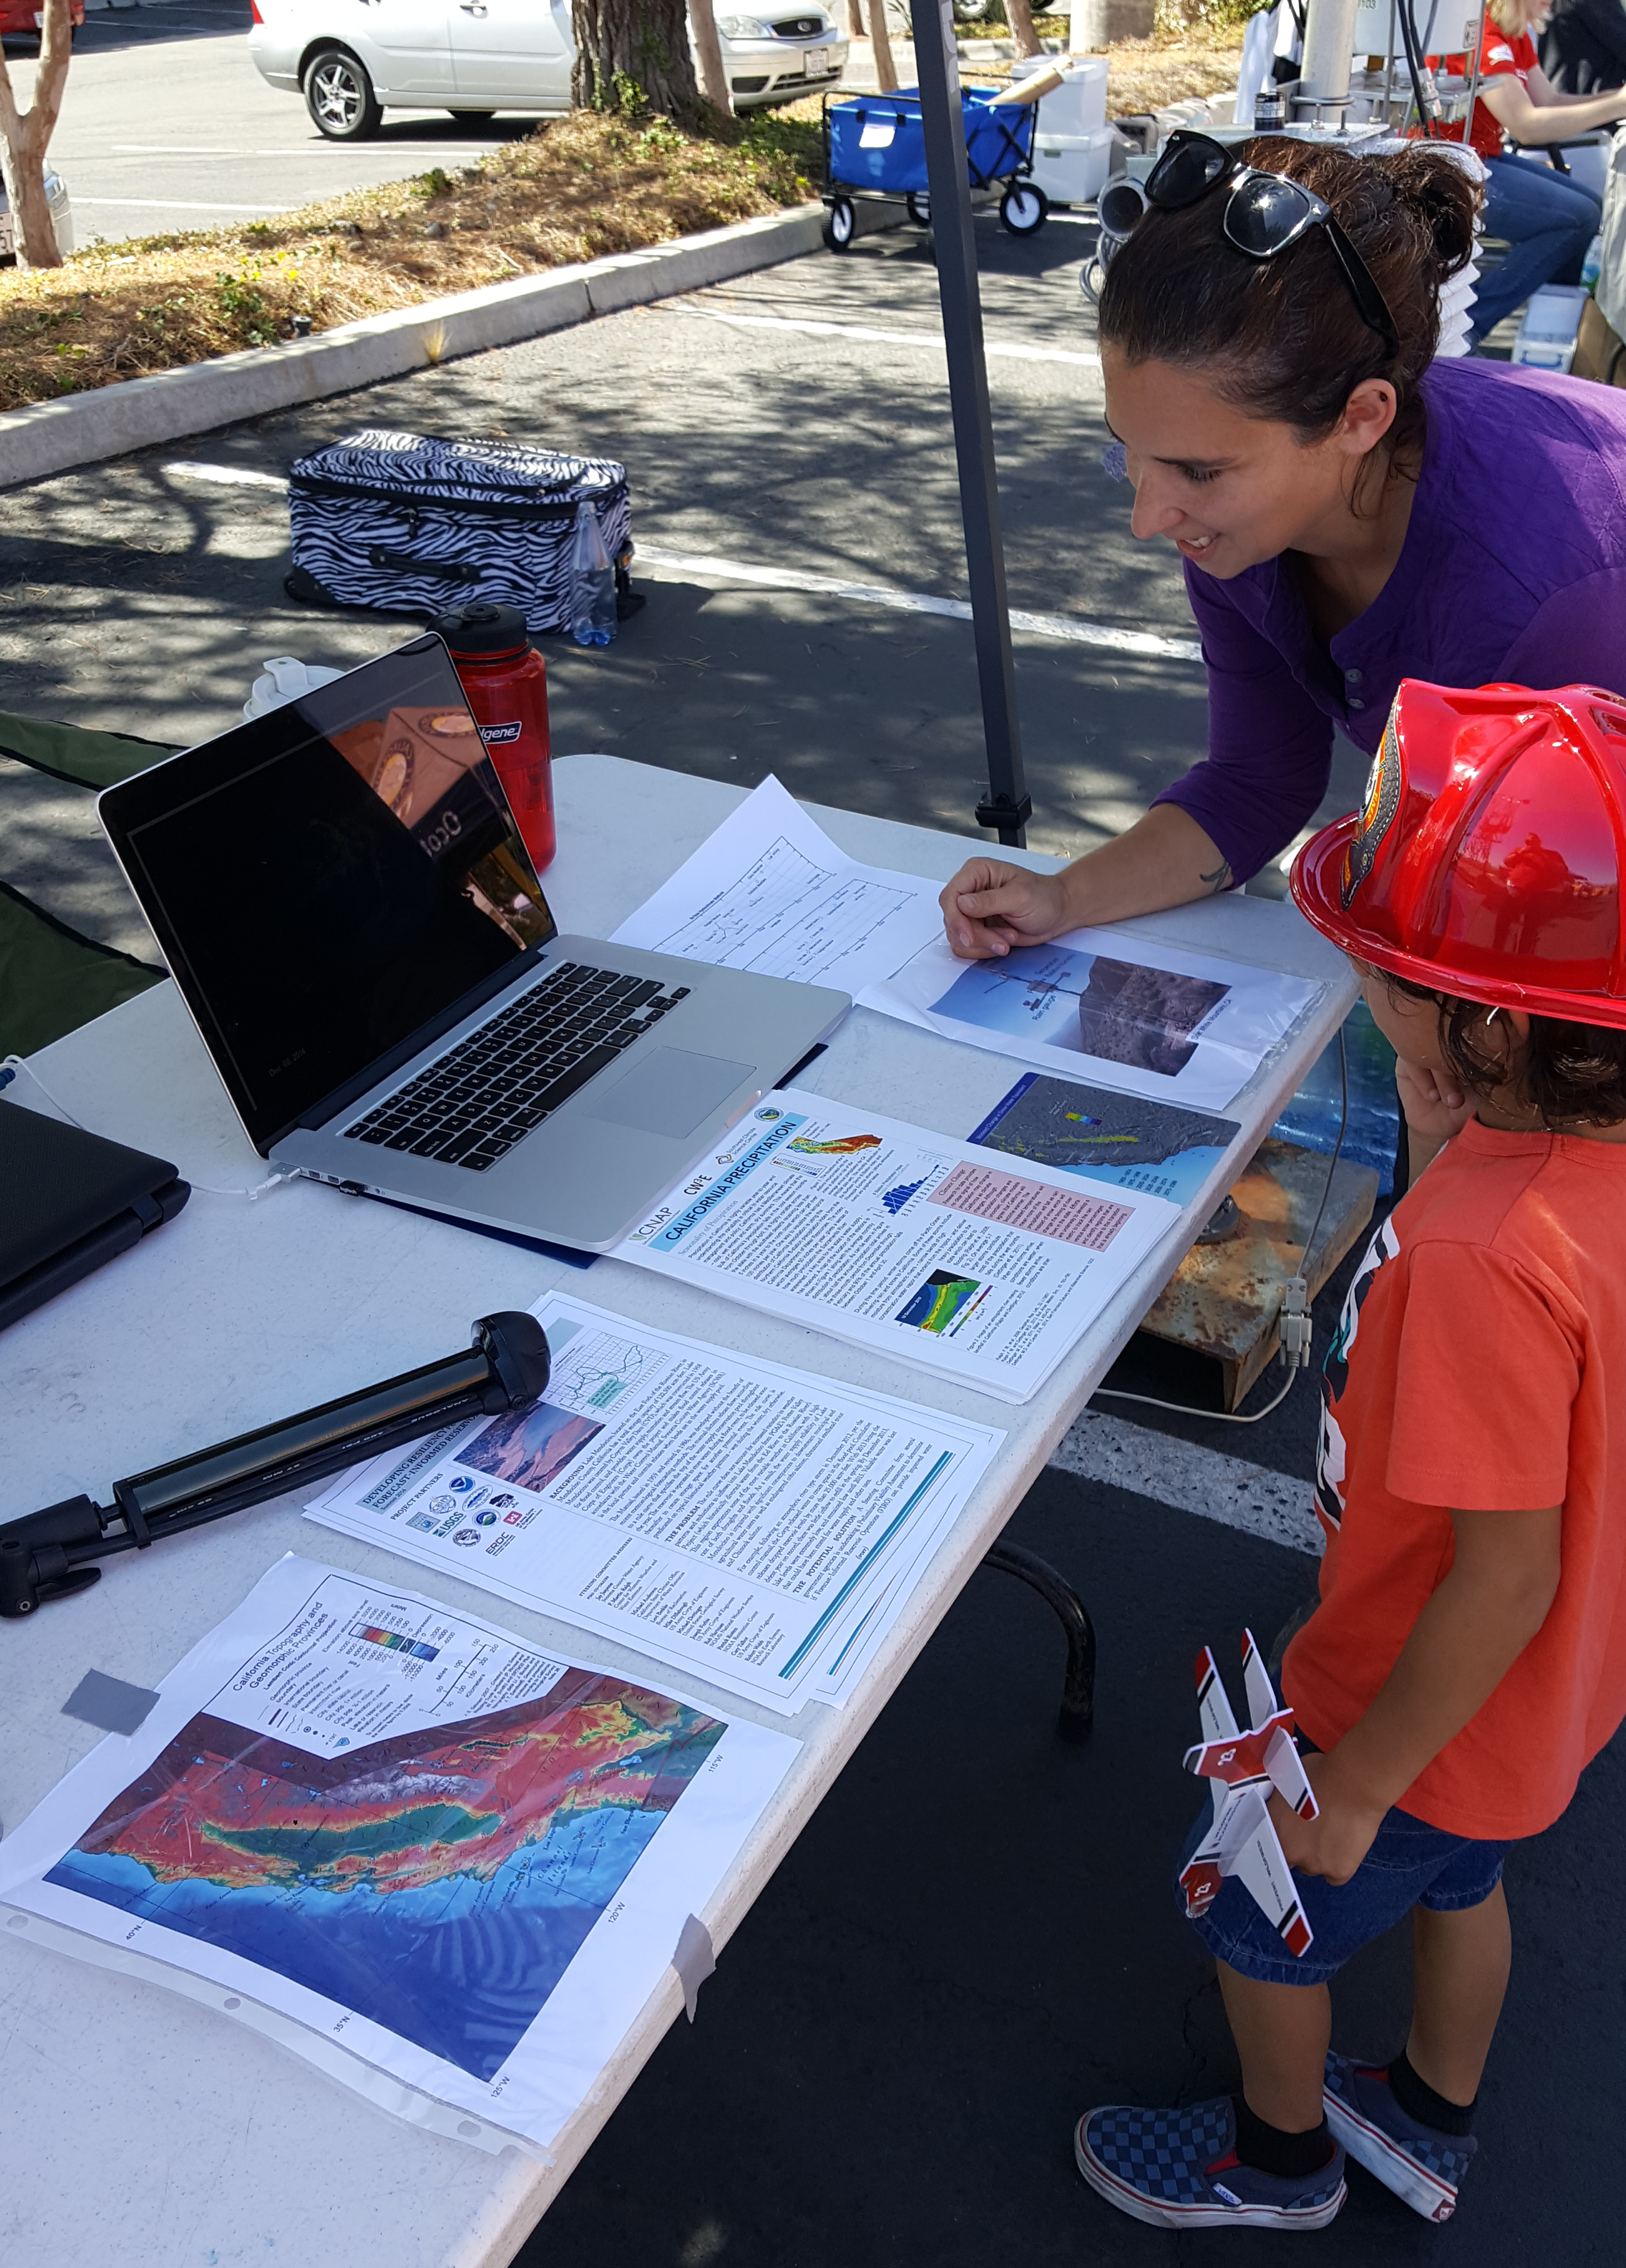
Dr. Anna Wilson explaining how weather looks from a satellite’s point of view at WeatherFest 2016 |
CW3E’s Rachel Weihs and Anna Wilson were on hand at the annual WeatherFest event hosted by the local National Weather Service office in San Diego, CA on September 17th, 2016. WeatherFest is presented by the Young Meteorologist Program and serves as an outreach event informing the general public on weather preparedness, safety, research, and education. Over 600 local weather enthusiasts attended this year’s WeatherFest where they were able to interact with representatives of the National Weather Service, first responders, research institutions, and local newscasters while enjoying games, viewing demonstrations, and gathering information. |
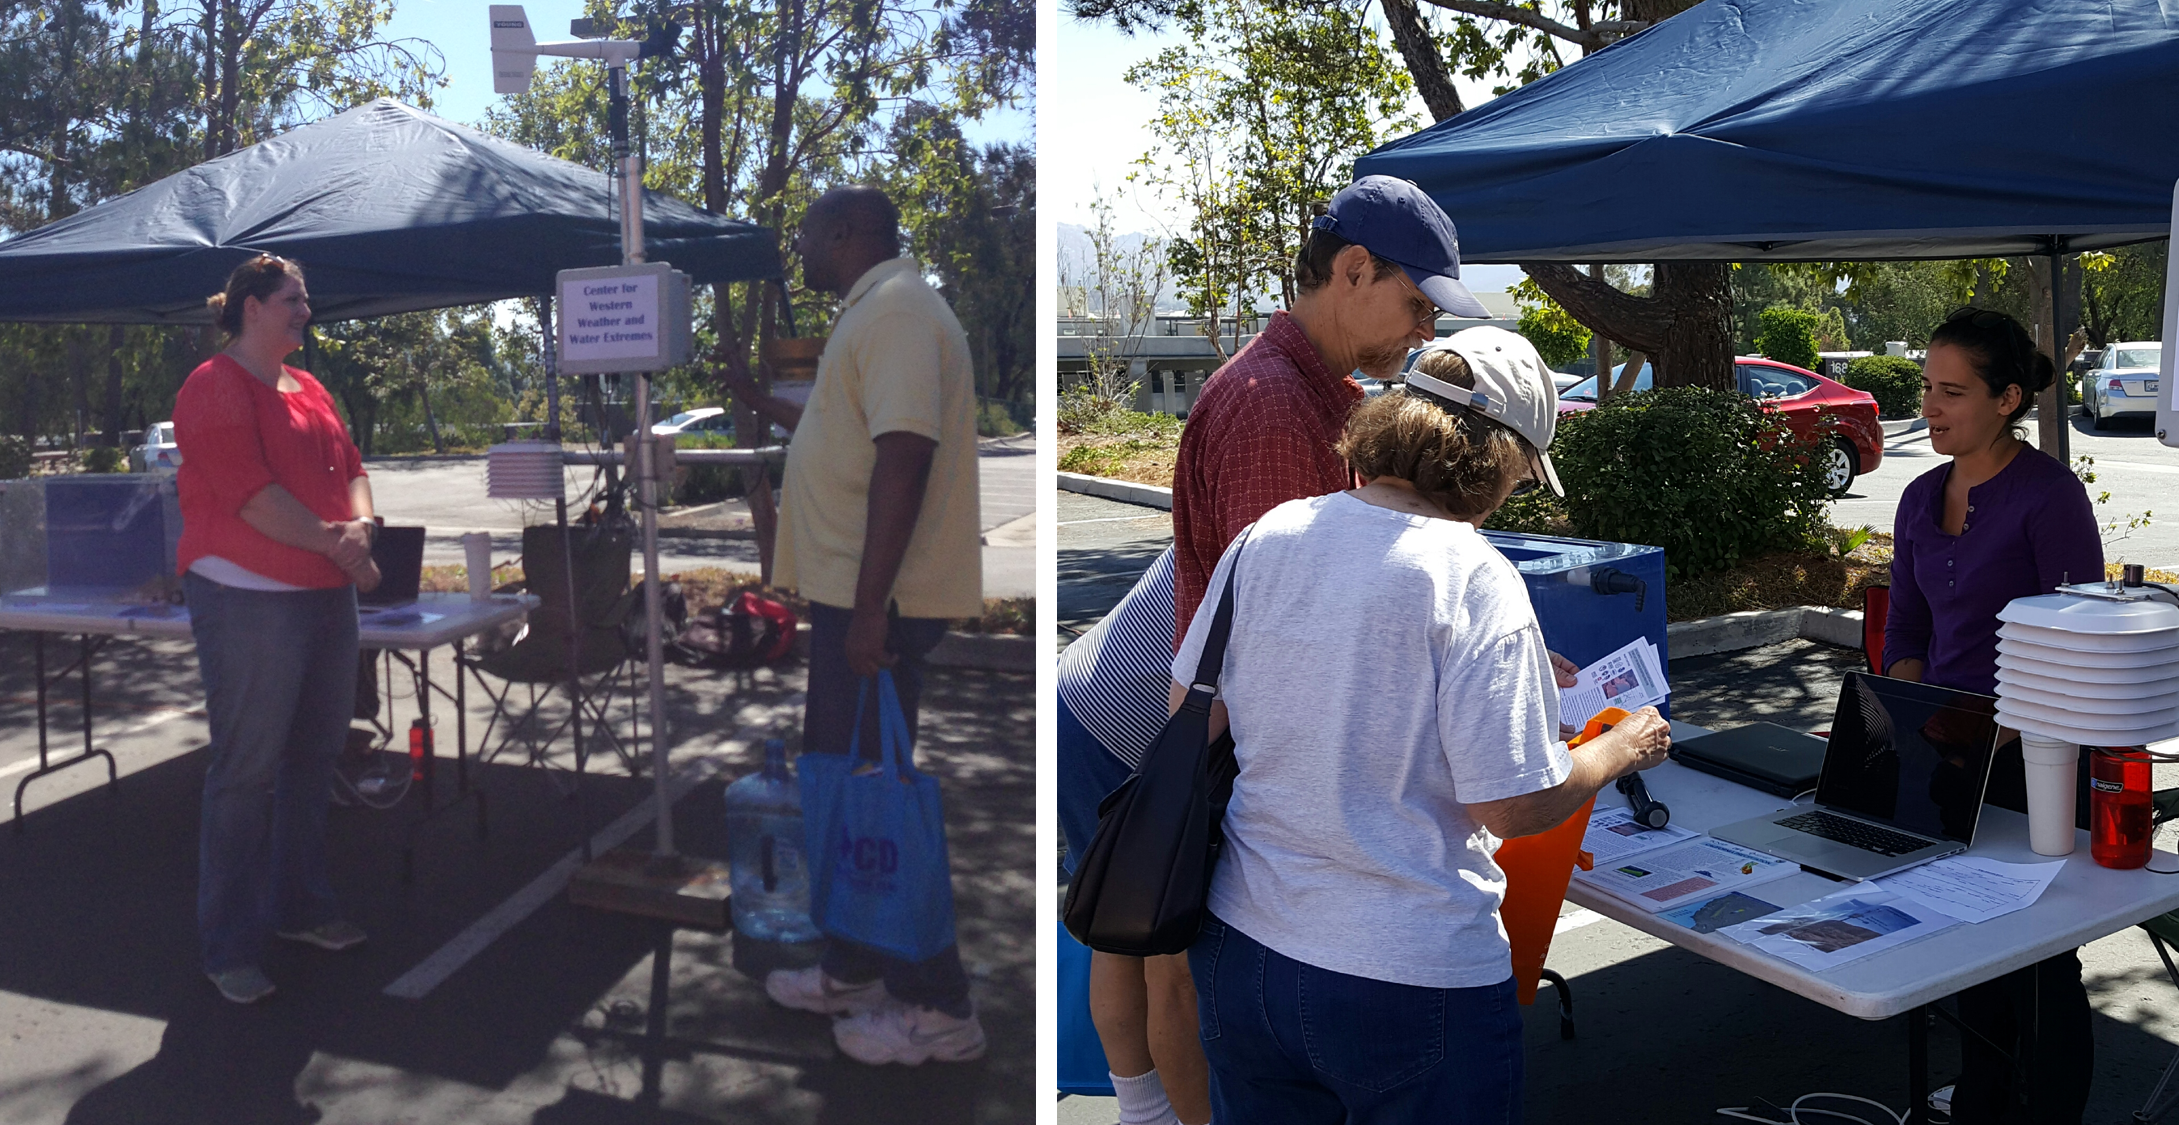
Dr. Rachel Weihs (left) and Dr. Anna Wilson (right) discussing CW3E’s Research with the publc. |
|
|
The CW3E booth showcased the ongoing research into atmospheric river (AR) events with emphasis on the major contribution of ARs to California’s annual precipitation and their associated impacts on the management of water resources, reservoir flood risk, and drought. Attendees learned about the term “Atmospheric River” by viewing satellite animations of the associated clouds and precipitation during an AR event in December 2014 and referencing the narrow river-like transport of moisture from the tropics using SSMI visualizations. The CW3E booth featured a fully-functioning weather station with state-of-the-art research quality instruments feeding live data into a computer for viewing. They also provided interactive demonstrations and graphical information highlighting the importance of California’s topography and the influence of orographic lift on the spatial distribution of precipitation. Adult attendees enjoyed comparing the weather instruments on display to those they had at home, talking about storms they had experienced during their lifetimes, and viewing the satellite animations. Kids enjoyed the diorama of the California coastline and simulating rainfall with the tipping bucket rain gauge on the weather station. Through these activities, attendees were able to gain a better understanding of ARs and their impact on daily life. |
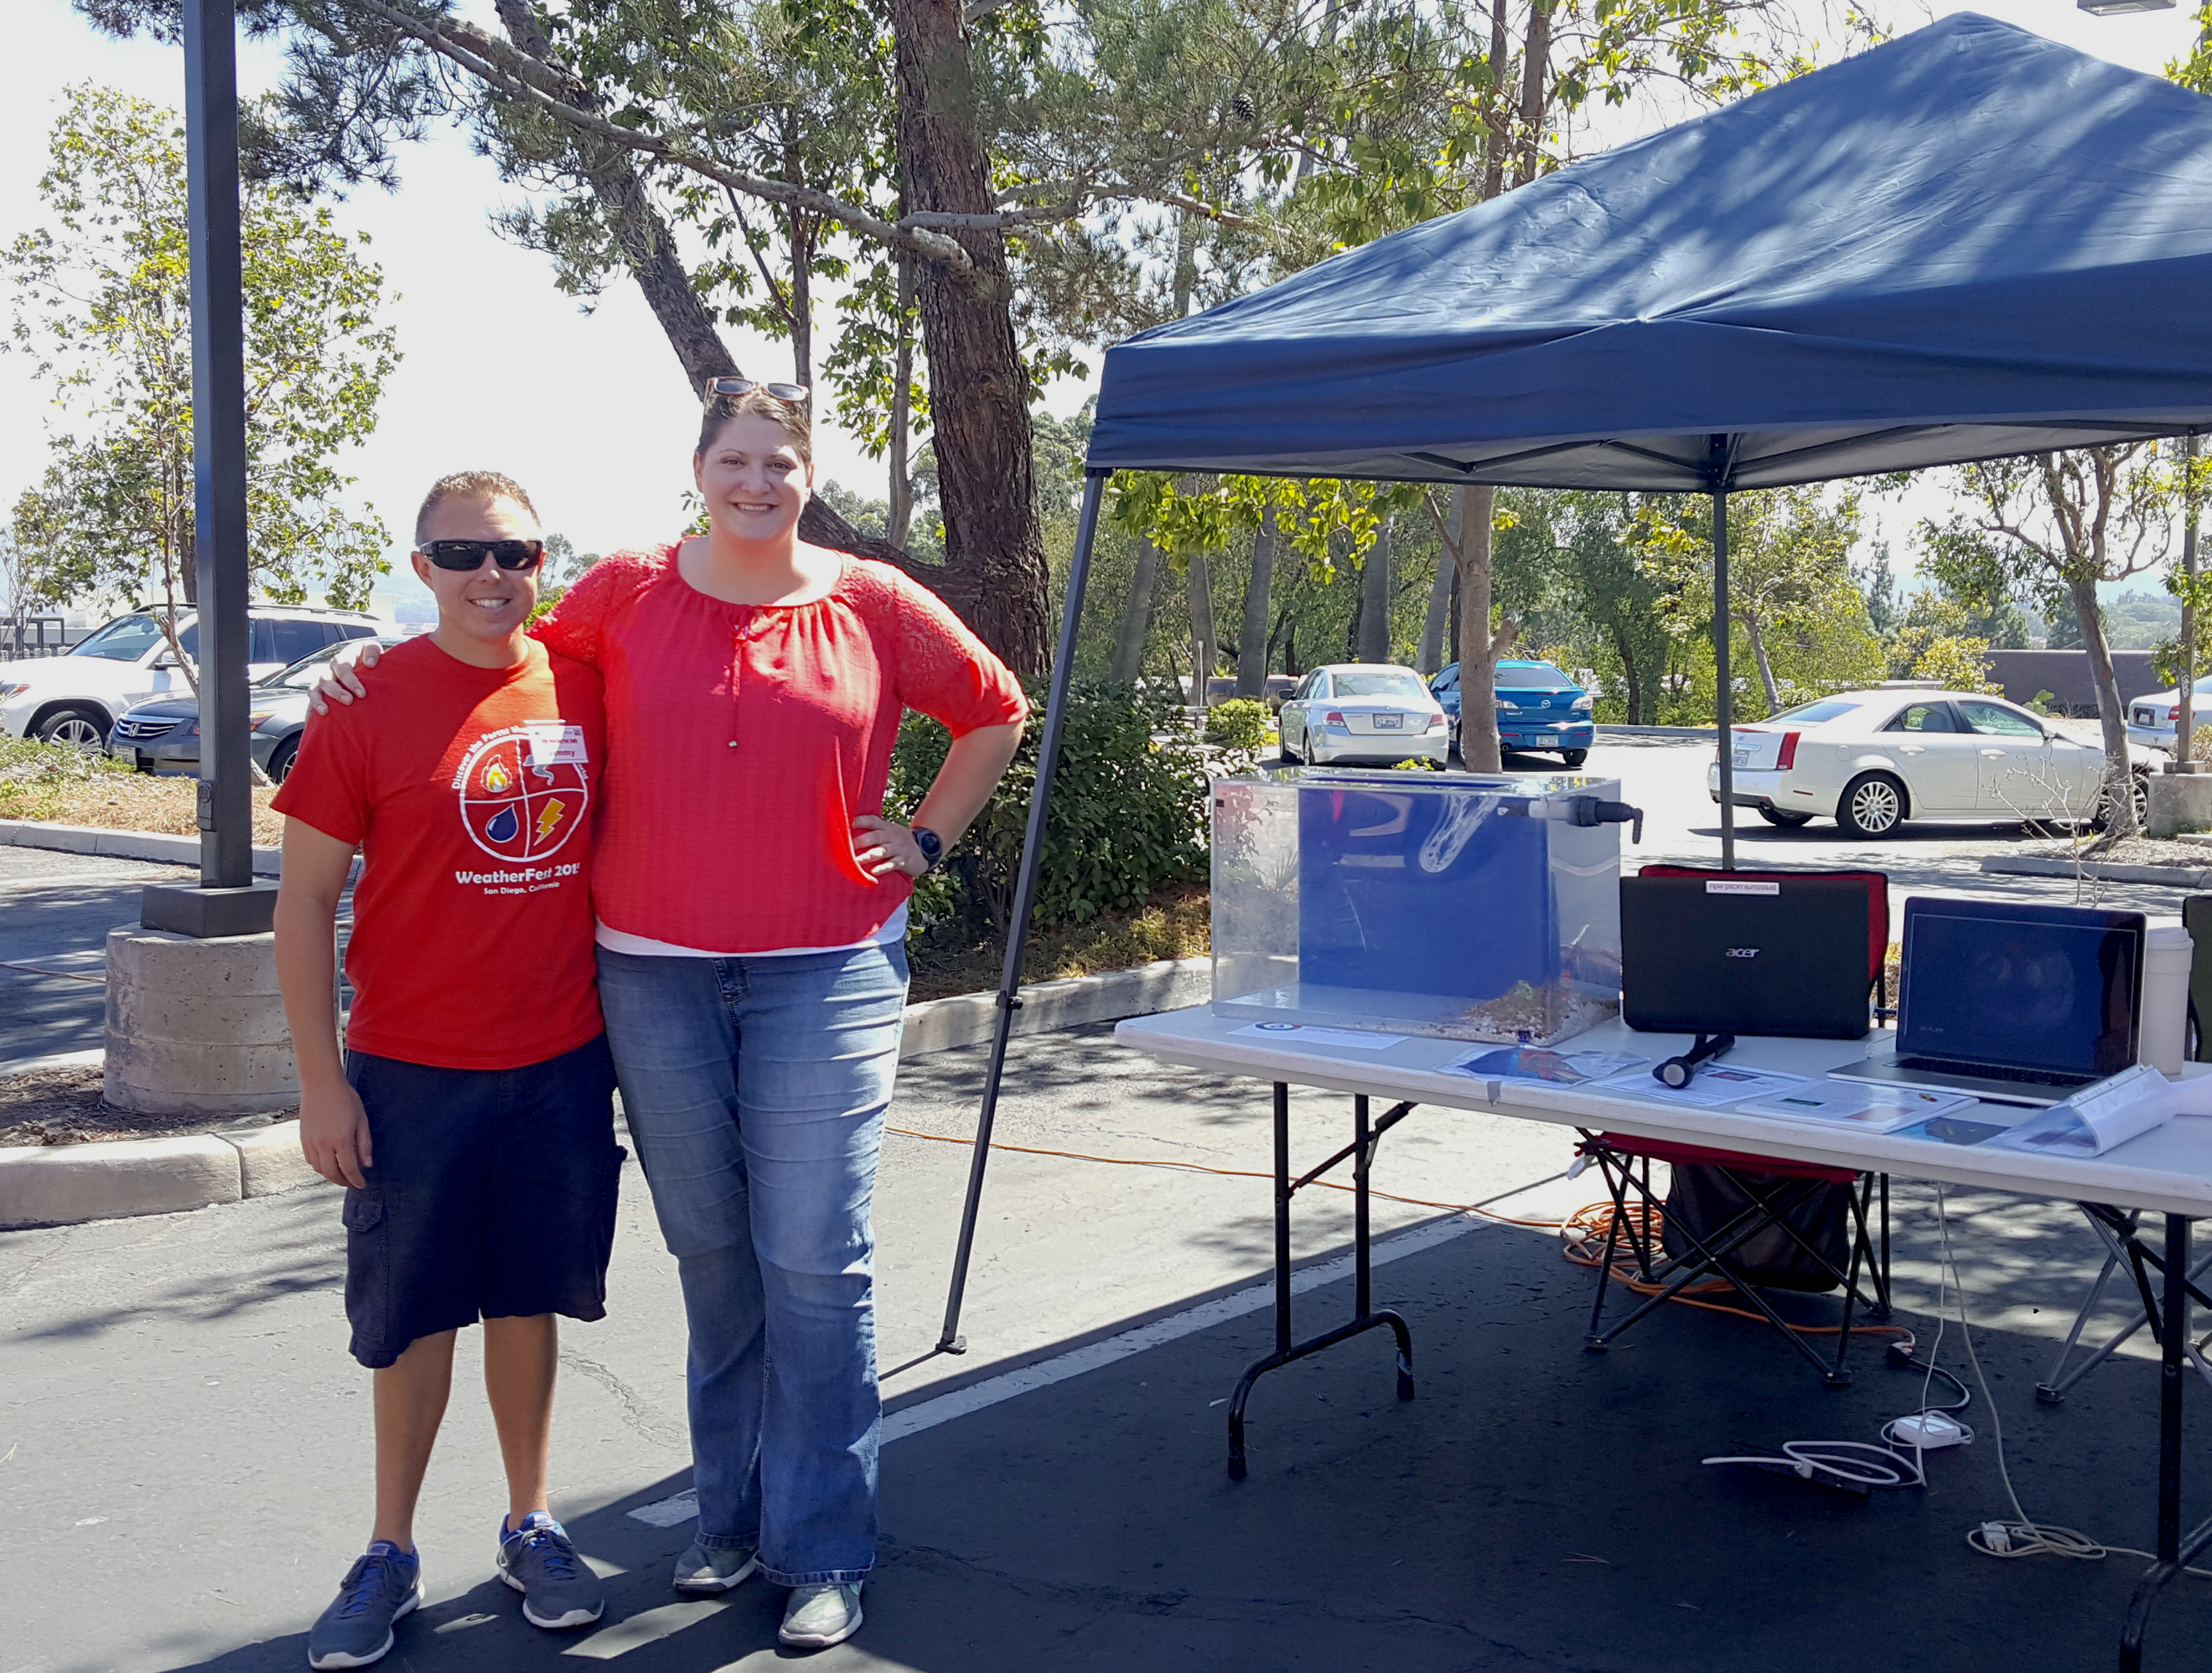
Dr. Rachel Weihs and James Taeger, General Forecaster at the San Diego NWS office, at the CW3E booth |
Contact: Anna Wilson (anna-m-wilson@ucsd.edu) and Rachel Weihs (rweihs@ucsd.edu)
CW3E welcomes Dr. Rachel Weihs
August 8, 2016
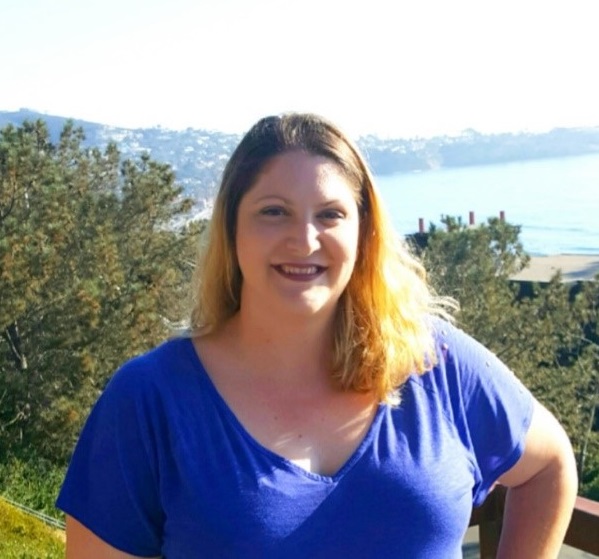
|
Dr. Rachel Weihs started at CW3E in August 2016 as a Postdoctoral Scholar. Rachel earned her Ph.D. in Meteorology at Florida State University in Tallahassee, Florida under the direction of Dr. Mark Bourassa. Her dissertation focused on understanding the role of high frequency variability of sea surface temperatures on the near-surface winds and atmospheric boundary layer as produced by the Weather Research and Forecasting model. In addition, she was able to quantify the relative impact of the local diurnal variability of sea surface temperatures on regional weather and deduce the importance of two-way air-sea feedback processes on the magnitude of diurnal heating in the upper ocean in the extratropical Atlantic. She is excited to have joined the CW3E team in August 2016 to study the influences of the Pacific Ocean on the forecasting of atmospheric rivers as well as examining the role of air-sea interaction on the boundary layer and the low level jet associated with these important weather phenomena. |
 |
CW3E welcomes Dr. Brian Henn
August 8, 2016
|
Dr. Brian Henn started at CW3E in August 2016 as a Postdoctoral Scholar. He is a native of Northern California and received undergraduate and master’s degrees from Princeton and Stanford in civil and environmental engineering. With interests in hydrology, water resources and infrastructure, he worked as an engineer on urban stormwater and sustainability projects at Hazen and Sawyer in New York City. Brian pursued doctoral studies at the University of Washington in the research group of Dr. Jessica Lundquist, receiving his Ph.D. in 2015. His dissertation used streamflow observations and novel modeling techniques to better understand orographic precipitation patterns over the Sierra Nevada mountain range. He is also a licensed civil engineer in California. |
 |
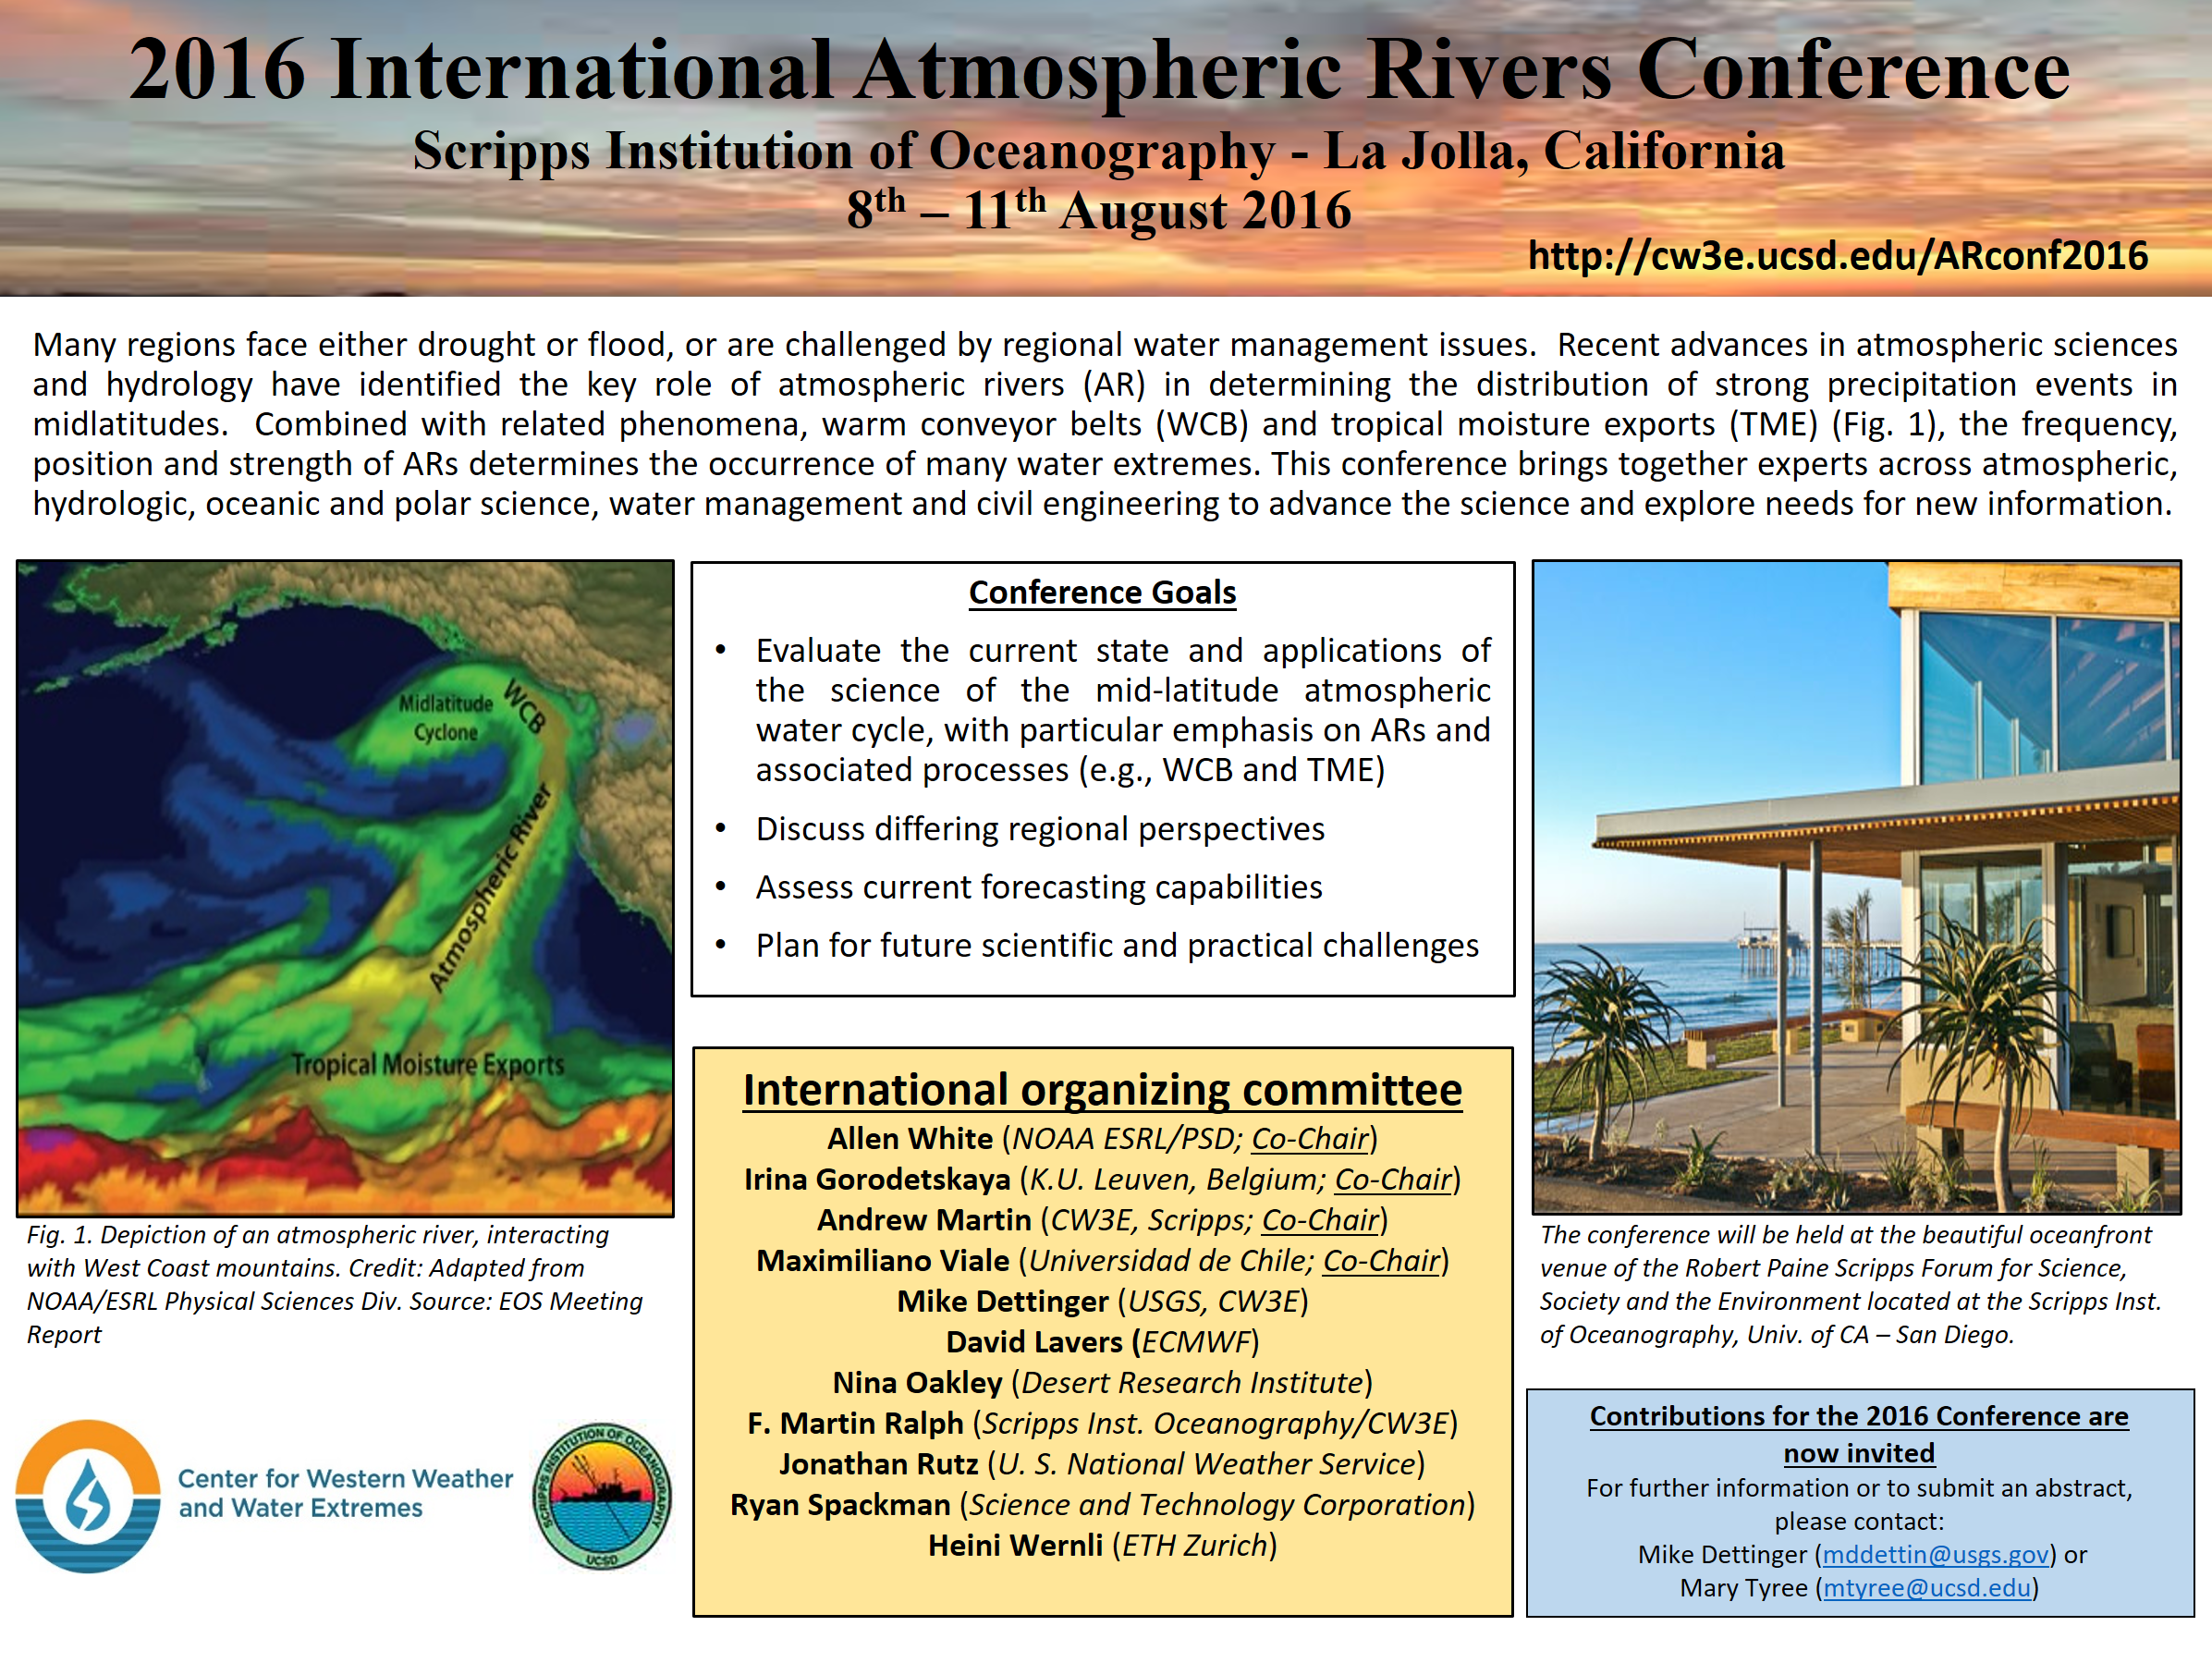
The First International Conference on Atmospheric Rivers (IARC) is Being Hosted by the Center for Wester Weather and Water Extremes (CW3E) at the Scripps Seaside Forum from 8-11 August 2016
August 8, 2016
IARC is part of a multi-year effort led by CW3E’s Director F. Martin Ralph, Mike Dettinger of USGS and David Lavers of ECMWF to foster collaboration and exchange of ideas on atmospheric rivers (AR).
Woven through this series of events over 3 years is the development of the AR Monograph, which has been funded by a grant, including publication by University of California Press. IARC brings together most of the Chapter authors, at a point in the writing where new ideas garnered during the conference can be incorporated into the Monograph. The goal is then to have the Monograph finalized and in print for the AR Summer Colloquium. A technical editor, Lauren Muscatine (and her experienced team from UC Davis), is supporting preparation of the Monograph.
IARC received 75 abstracts from people around the world studying ARs, their impacts and applications of AR information to decision making. Submissions represent work on 6 continents plus Greenland. It has been planned by an international steering committee of experts on the subject. 90 people have registered for the conference, which will include several invited presentations, oral sessions, a poster session, panels on “applications to decision making,” “converging on a definition of atmospheric rivers” and on “future directions.” Breakout sessions will be held on “AR Forecasting,” “AR Book Chapters” and on “ARs in future climates and subseasonal to seasonal prediction.”
Sessions are organized around the following themes, which represent sections in the AR Monograph:
Contact: F. Martin Ralph (mralph@ucsd.edu)
CW3E Publication Notice
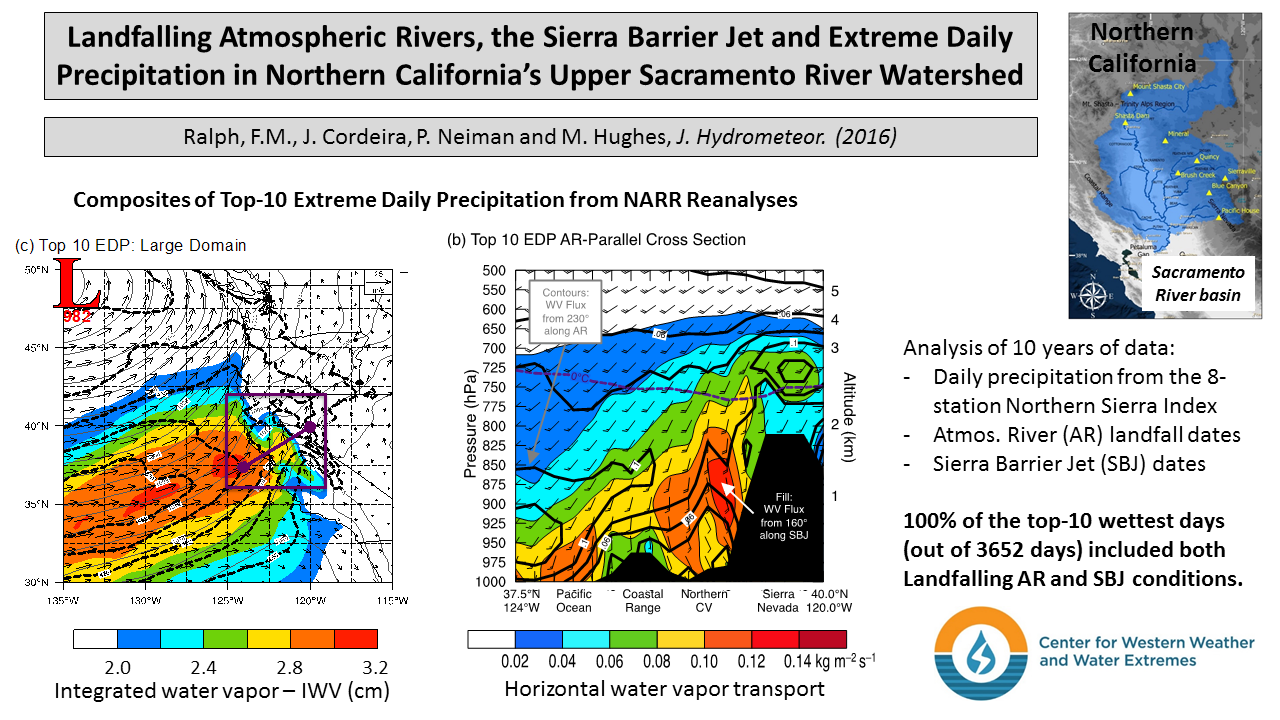
Extreme Daily Precipitation in the Northern California Upper Sacramento River Watershed Requires a Combination of a Landfalling Atmospheric River and a Sierra Barrier Jet
July 18, 2016
Ralph, F.M., J.M. Cordeira, P.J. Neiman and M. Hughes, 2016: Extreme Daily Precipitation in the Northern California Upper Sacramento River Watershed Requires a Combination of a Landfalling Atmospheric River and a Sierra Barrier Jet. J. Hydrometeor., 17, 1904-1915.
The top 0.3% most extreme daily precipitation events in the key Sacramento River watershed all involved both a landfalling atmospheric river and a Sierra Barrier Jet. Thus, forecasts of extreme precipitation are related to the skill of forecasts of each of these key phenomena, and can be enhanced by evaluation of, and enhancement of, skill in predicting each of these key processes. This study was led by the CW3E Director, was supported by the California Department of Water Resources, used data from NOAA’s Hydrometeorology Testbed collected over a decade, and epitomizes the focus of the “Center for Western Weather and Water Extremes,” and its partnership with NOAA Research’s Physical Sciences Division and Plymouth State University.
Contact: F. Martin Ralph (mralph@ucsd.edu)
Abstract
The upper Sacramento River watershed is vital to California’s water supply and is susceptible to major floods. Orographic precipitation in this complex terrain involves both atmospheric rivers (ARs) and the Sierra barrier jet (SBJ). The south-southeasterly SBJ induces orographic precipitation along south-facing slopes in the Mt. Shasta–Trinity Alps, whereas landfalling ARs ascend up and over the statically stable SBJ and induce orographic precipitation along west-facing slopes in the northern Sierra Nevada. This paper explores the occurrence of extreme daily precipitation (EDP) in this region in association with landfalling ARs and the SBJ. The 50 wettest days (i.e., days with EDP) for water years (WYs) 2002–11 based on the average of daily precipitation from eight rain gauges known as the Northern Sierra 8-Station Index (NS8I) are compared to dates from an SSM/I satellite-based landfalling AR-detection method and dates with SBJ events identified from nearby wind profiler data. These 50 days with EDP accounted for 20% of all precipitation during the 10-WY period, or 5 days with EDP per year on average account for one-fifth of WY precipitation. In summary, 46 of 50 (92%) days with EDP are associated with landfalling ARs on either the day before or the day of precipitation, whereas 45 of 50 (90%) days with EDP are associated with SBJ conditions on the day of EDP. Forty-one of 50 (82%) days with EDP are associated with both a landfalling AR and an SBJ. The top 10 days with EDP were all associated with both a landfalling AR and an SBJ.
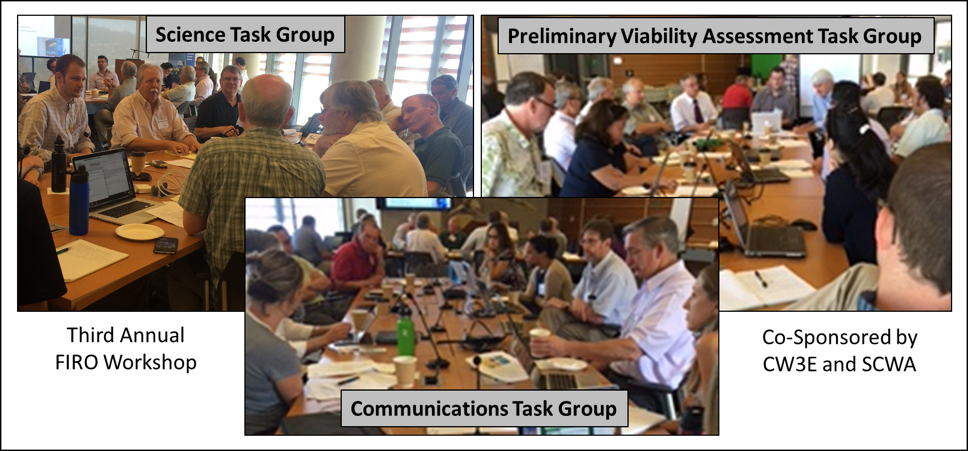
Lake Mendocino Forecast-Informed Reservoir Operations (FIRO) Workshop Summary
July 5, 2016
Experts from multiple disciplines and organizations came together for the third annual FIRO workshop, which was held at UC San Diego/Scripps Institution of Oceanography (SIO) from 27-29 June 2016. This workshop was hosted jointly by the Sonoma County Water Agency (SCWA) and SIO’s Center for Western Weather and Water Extremes (CW3E). It was organized by the FIRO Steering Committee, co-chaired by CW3E’s Marty Ralph and SCWA’s Jay Jasperse. There were a total of 52 attendees from organizations including the US Army Corps of Engineers (USACE), California Department of Water Resources (CA DWR), National Oceanic and Atmospheric Administration (NOAA), US Geological Survey (USGS), US Bureau of Reclamation (USBR), SCWA and CW3E.
During the workshop, participants shared recent updates on FIRO activities, discussed reservoir conditions during water year 2016, summarized progress toward goals identified in the FIRO Workplan and identified issues to address regarding development of the Lake Mendocino FIRO “Preliminary Viability Assessment.” Progress was summarized on defining FIRO information requirements (e.g., forecast parameters and lead times), assessing current forecast skill, exploring the origins of forecast errors, advances in atmospheric river science, results of preliminary estimates of FIRO implications on Lake Mendocino water supply, and discussion of potential additional reservoirs for which FIRO may hold promise. Individual task groups (Preliminary Viability Assessment, Science, and Communications/Outreach) conducted break-out sessions in order to discuss progress and next steps towards meeting project goals (see photos below). In addition, the 11-member Lake Mendocino FIRO Steering Committee met afterward to review the workshop outcomes and plans. In short, the initial goals of year-1 of the 5-year FIRO Workplan are on track to be met, including development of the Preliminary Viability Assessment. Longer-term actions supporting the Full Viability Assessment are beginning and transferability is being discussed.
Lake Mendocino FIRO is summarized at /firo/.
Contacts: F. Martin Ralph (CW3E Director; mralph@ucsd.edu) and J. Jasperse (SCWA Chief Engineer; Jay.Jasperse@scwa.ca.gov)
CW3E Publication Notice
An Airborne and Ground-Based Study of a Long-Lived and Intense Atmospheric River with Mesoscale Frontal Waves Impacting California during CalWater-2014
May 10, 2016
Neiman, P.J., B.J. Moore, A.B. White, G.A. Wick, J. Aikins, D.L. Jackson, J.R Spackman, and F.M. Ralph, 2016: An Airborne and Ground-Based Study of a Long-Lived and Intense Atmospheric River with Mesoscale Frontal Waves Impacting California during CalWater-2014. Mon. Wea. Rev., 144, 1115-1144.
This study provides the most comprehensive observations to date of a mesoscale frontal wave associated with an atmospheric river, including its structure offshore, landfall characteristics and impacts on precipitation. It utilizes research aircraft, a unique array of coastal hydrometeorological measurements and inland data. This paper reflects the broader scientific collaboration between CW3E and NOAA/PSD, and adds to the knowledge of phenomena that are critical to creating extreme precipitation on the U.S. West Coast – a major thrust of CW3E. Dr. Ralph contributed to this paper by proposing the experiment (Ralph et al. 2016 BAMS), identifying the science objective for the flights (i.e., mapping out the structure of a mesoscale frontal wave with dropsondes and airborne radar), laying out the flight tracks, guiding the mission onboard, having been the PI of the major projects that created the unique land-based observing network (NOAA HMT- Ralph et al. 2013 BAMS, and the DWR-sponsored EFREP mesonet – White et al. 2013 JTech) used in the study and contributing to the analysis and interpretation of the measurements in this paper.
Contacts: Paul Neiman (paul.j.neiman@noaa.gov) and F. Martin Ralph (mralph@ucsd.edu)
Abstract
The wettest period during the CalWater-2014 winter field campaign occurred with a long-lived, intense atmospheric river (AR) that impacted California on 7–10 February. The AR was maintained in conjunction with the development and propagation of three successive mesoscale frontal waves. Based on Lagrangian trajectory analysis, moist air of tropical origin was tapped by the AR and was subsequently transported into California. Widespread heavy precipitation (200–400 mm) fell across the coastal mountain ranges northwest of San Francisco and across the northern Sierra Nevada, although only modest flooding ensued due to anomalously dry antecedent conditions. A NOAA G-IV aircraft flew through two of the frontal waves in the AR environment offshore during a ;24-h period. Parallel dropsonde curtains documented key three dimensional thermodynamic and kinematic characteristics across the AR and the frontal waves prior to landfall. The AR characteristics varied, depending on the location of the cross section through the frontal waves. A newly implemented tail-mounted Doppler radar on the G-IV simultaneously captured coherent precipitation features. Along the coast, a 449-MHz wind profiler and collocated global positioning system (GPS) receiver documented prolonged AR conditions linked to the propagation of the three frontal waves and highlighted the orographic character of the coastal-mountain rainfall with the waves’ landfall. Avertically pointing S-PROF radar in the coastal mountains provided detailed information on the bulk microphysical characteristics of the rainfall. Farther inland, a pair of 915-MHz wind profilers and GPS receivers quantified the orographic precipitation forcing as the AR ascended the Sierra Nevada, and as the terrain-induced Sierra barrier jet ascended the northern terminus of California’s Central Valley.

CW3E Represented in Recent Policy and Program Meetings
June 8, 2017
During the last few weeks CW3E’s perspectives have been highlighted at three science policy-oriented meetings. The connection between CW3E’s scientific activities, practical applications and water policy implications is a common theme among them. The meetings and a brief synopsis are provided below:
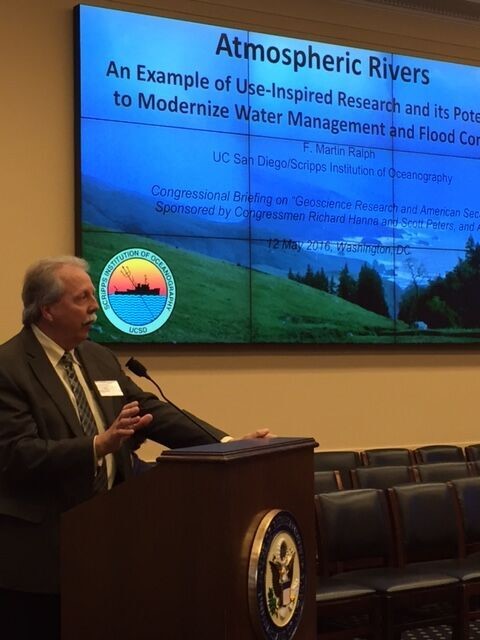
1) AGU Congressional briefing on role of basic Geoscience in American Security May 2016
AGU invited three speakers to a Congressional briefing they organized to communicate to staff supporting a number of elected officials and policy committees. The goal was to make the connection between basic science advances (and the funding that has supported them), and benefits to American Security. CW3E’s Director, Dr. Ralph, represented the role of basic geoscience research in advancing water security in the Western U.S. His presentation emphasized the critical roles of key science funding strategies, from standard grants programs, to directed research efforts, cooperative agreements and federal labs. And in the end concluded that many breakthrough advances result not from a systems engineering approach to deciding what to do, but from ideas that are “outside the box.” He also highlighted that science, at its core, is fundamentally a creative endeavor that requires long-term support for people in their careers and for the organizations that host them. AGU has posted a video of the briefings here.
2) NOAA Water Information “Listening Session” in Sacramento May 2016
NOAA invited water management stakeholders from across the West to hear about the National Water Center they are creating in Alabama and to listen to stakeholders interests and needs for weather and water information to support water supply, flood mitigation and endangered species restoration in the West. CW3E was represented by Dr. Ralph, who brought Scripps science into the discussion, and supported major points presented by water managers concerning the vital role of atmospheric rivers in western water decisions. NOAA held one other regional “listening session” – in Alabama, and is holding one more “National” session in July. They will be considering input from these meeting as they develop their agency’s strategies in the coming years to support water information needs for the nation.
3) WSWC S2S Workshop San Diego June 2016
The National Academies of Science recently released a report on the subject of science needed to enable subseasonal-to-seasonal predictions to support decisions. The Western States Water Council (a group supporting the Governors of 17 Western States) organized a regional Workshop in San Diego in early June to discuss both the user requirements for better forecasts and the science opportunities to achieve them. CW3E was represented well, including participation by Sasha Gerhunov, Tamara Shulgina and Marty Ralph, including a presentation by Marty on observing system needs to support the goals.