CW3E Publication Notice
Forecasting Atmospheric Rivers during CalWater 2015
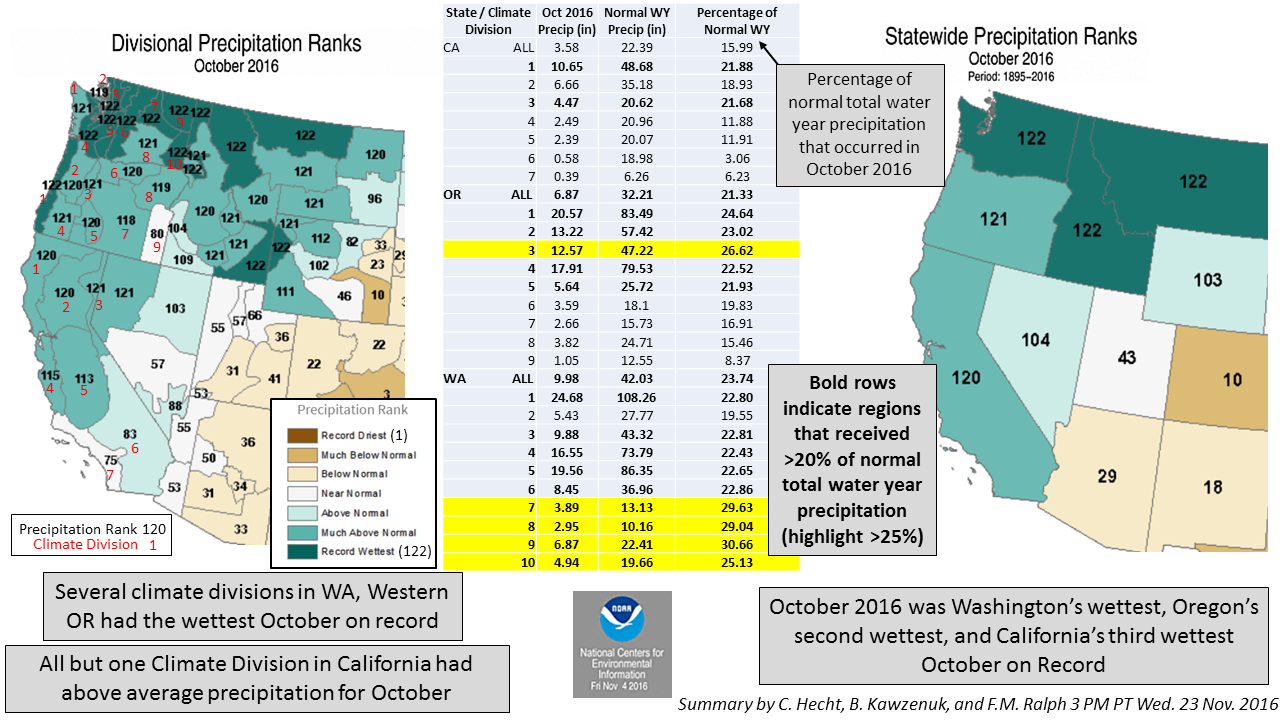
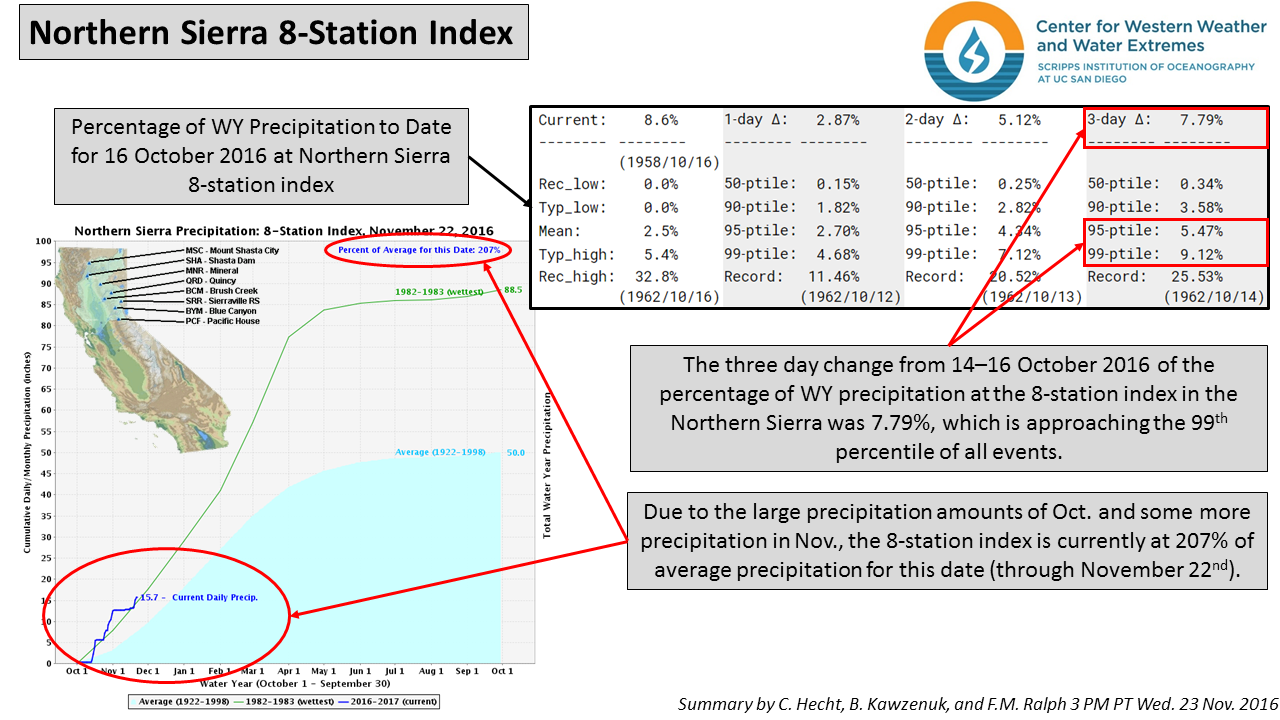
November 22, 2016
Cordeira, J., F. Ralph, A. Martin, N. Gaggini, R. Spackman, P. Neiman, J. Rutz, and R. Pierce, 0: Forecasting Atmospheric Rivers during CalWater 2015. Bull. Amer. Meteor. Soc., 0, doi: 10.1175/BAMS-D-15-00245.1.
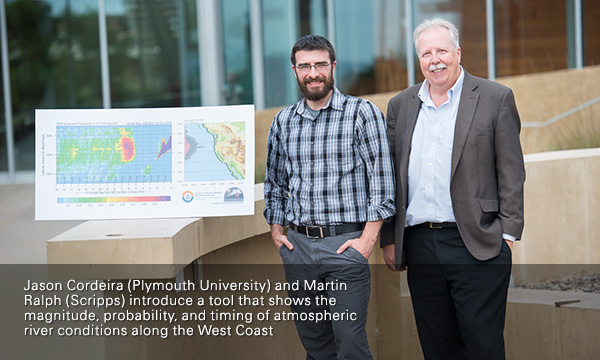
As part of CW3E’s mission and goals a new set of atmospheric river (AR)-focused diagnostic and prediction tools have been created, in close partnership with Plymouth State University’s Prof. Jason Cordeira, and building upon work done earlier at NOAA under the HMT Program (see Ralph et al. 2013 BAMS, Wick et al. 2013 Wea. Forecasting). These developments were accelerated and focused by the needs for specialized AR forecast displays to support the CalWater field campaigns in 2014 and 2015 (see Ralph et al. 2016, BAMS). CalWater used research aircraft to observe atmospheric rivers and carried out aerosol science. These developments are summarized in a paper on the forecasting tools that were used in the CalWater field campaign by CW3E researchers and collaborators (Cordeira et al.) that was recently published in Bulletin of the American Meteorological Society (BAMS). The paper details some of the new AR forecasting tools developed using NCEP Global Forecast System and Global Ensemble Forecast System. A novel AR landfall detection forecast tool illustrates the probability of AR conditions at different locations along the western coast of the US. Another new forecast tool that used the various ensemble members illustrates the possible range of integrated water vapor transport (IVT) at a specific location using each of the ensemble members. In addition, the high quality plots of forecasted IVT and observed integrated water vapor supported the CalWater field campaign. Beyond supporting the CalWater Field Campaign, these new forecasting tools will likely improve AR forecasting throughout the West Coast. All these and more of the new forecasting tools can be found on the CW3E website under “Atmospheric River Resources.”
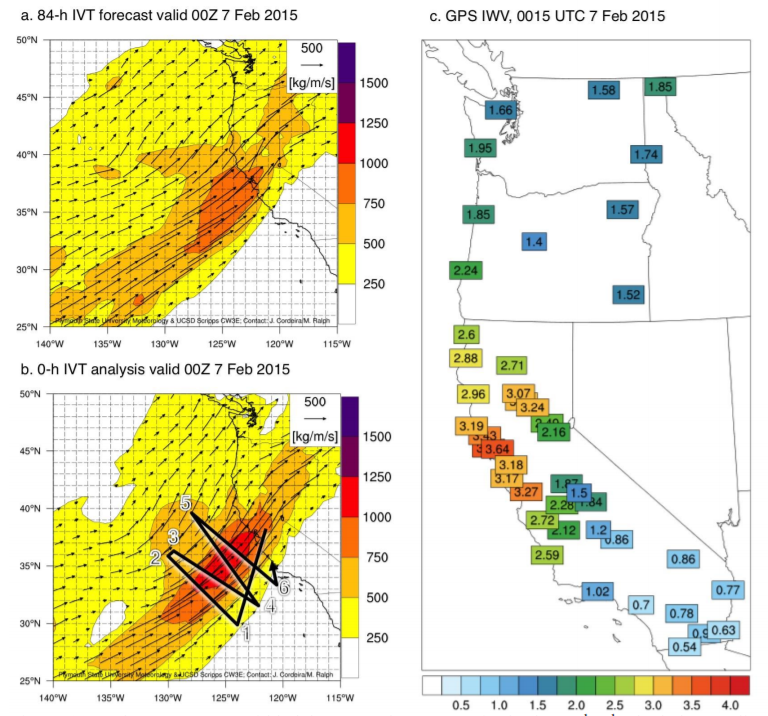
84-h NCEP GFS gridded forecast of IVT magnitude (kg m-1s-1 and direction; initialized at 1200 UTC on 3 February 2015; (b) as in (a), except for the verifying analysis of IVT magnitude and direction at 0000 UTC 7 February 2015 with overlaid draft flight track of the NOAA G-IV aircraft (c) GPS-derived IWV (mm) at 0015 UTC 7 February 2015.
Abstract
Atmospheric Rivers (ARs) are long and narrow corridors of enhanced vertically integrated water vapor (IWV) and IWV transport (IVT) within the warm sector of extratropical cyclones that can produce heavy precipitation and flooding in regions of complex terrain, especially along the U.S. West Coast. Several field campaigns have investigated ARs under the “CalWater” program of field studies. The first field phase of CalWater during 2009–2011 increased the number of observations of precipitation and aerosols, among other parameters, across California and sampled ARs in the coastal and near-coastal environment, whereas the second field phase of CalWater during 2014–2015 observed the structure and intensity of ARs and aerosols in the coastal and offshore environment over the Northeast Pacific. This manuscript highlights the forecasts that were prepared for the CalWater field campaign in 2015 and the development and use of an “AR portal” that was used to inform these forecasts. The AR portal contains archived and real-time deterministic and probabilistic gridded forecast tools related to ARs that emphasize water vapor concentrations and water vapor flux distributions over the eastern North Pacific, among other parameters, in a variety of formats derived from the NCEP Global Forecast System and Global Ensemble Forecast System. The tools created for the CalWater 2015 field campaign provided valuable guidance for flight planning and field activity purposes, and may prove useful in forecasting ARs and better anticipating hydrometeorological extremes along the U.S. West Coast.
Click here for personal use PDF file
Points of contact: Jason Cordeira, F. Martin Ralph, Brian Kawzenuk